

Procurement Benchmarking Report: What It Is and How to Use It
TL;DR: A procurement benchmarking report compares procurement costs, processes, supplier performance, and outcomes against internal, external, market, or best-in-class benchmarks.
It helps teams spot gaps, set realistic targets, and improve sourcing, supplier, and cost management decisions over time.
A procurement benchmarking report turns purchasing data into a practical performance baseline. It looks beyond price comparison and considers what was bought, how it was sourced, how suppliers performed, and how results compare with credible reference points.
For construction, engineering, and project delivery teams, that context matters. Procurement choices affect schedule certainty, quality, claims exposure, rework, and final project cost. A good report explains the data, normalizes comparisons fairly, highlights the right metrics, and points to actions the team can take.
What Is a Procurement Benchmarking Report?
A procurement benchmarking report is a structured document that compares procurement costs, processes, supplier performance, compliance, and outcomes against a defined benchmark. That benchmark may come from internal history, peer organizations, market trends, or recognized industry standards.
The point is not only to show whether prices are high or low. As The Hackett Group notes, effective benchmarking combines quantitative data with qualitative assessment to identify performance gaps, root causes, and realistic improvement targets. It can also compare procurement processes and outcomes against industry best practices, not just internal history.
In practice, the report builds a credible baseline, measures where performance differs from the target, and uses the findings to improve sourcing, supplier management, and cost control. It helps teams determine whether suppliers are delivering the best value and turn the results into practical insights. It also complements forecasting and cost control in project management by giving teams a reference point for what costs and performance should reasonably look like. When gaps point to capability limits, it can also support investment in technology, automation, better data quality, or process improvement.
That is what separates benchmarking from a simple quote comparison: the answer lies in a broader assessment than price alone. A one-off price check can be useful, but it rarely shows the full picture. A benchmarking report looks at total cost, process efficiency, supplier reliability, delivery performance, quality, risk, and contract management over time.
Internal benchmarks show how performance is changing against your own history. External benchmarks show how you compare with similar organizations. Best-in-class benchmarks show what Best-in-Class organizations in your sector are achieving and give the procurement organization a clear performance reference point.
What a Procurement Benchmarking Report Should Include
A strong procurement benchmarking report should make clear what was measured, how it was measured, and what the results mean for the business, including how the insights help businesses optimise procurement practices and supplier management. If readers cannot understand the scope, assumptions, or data sources, the conclusions will be hard to trust.
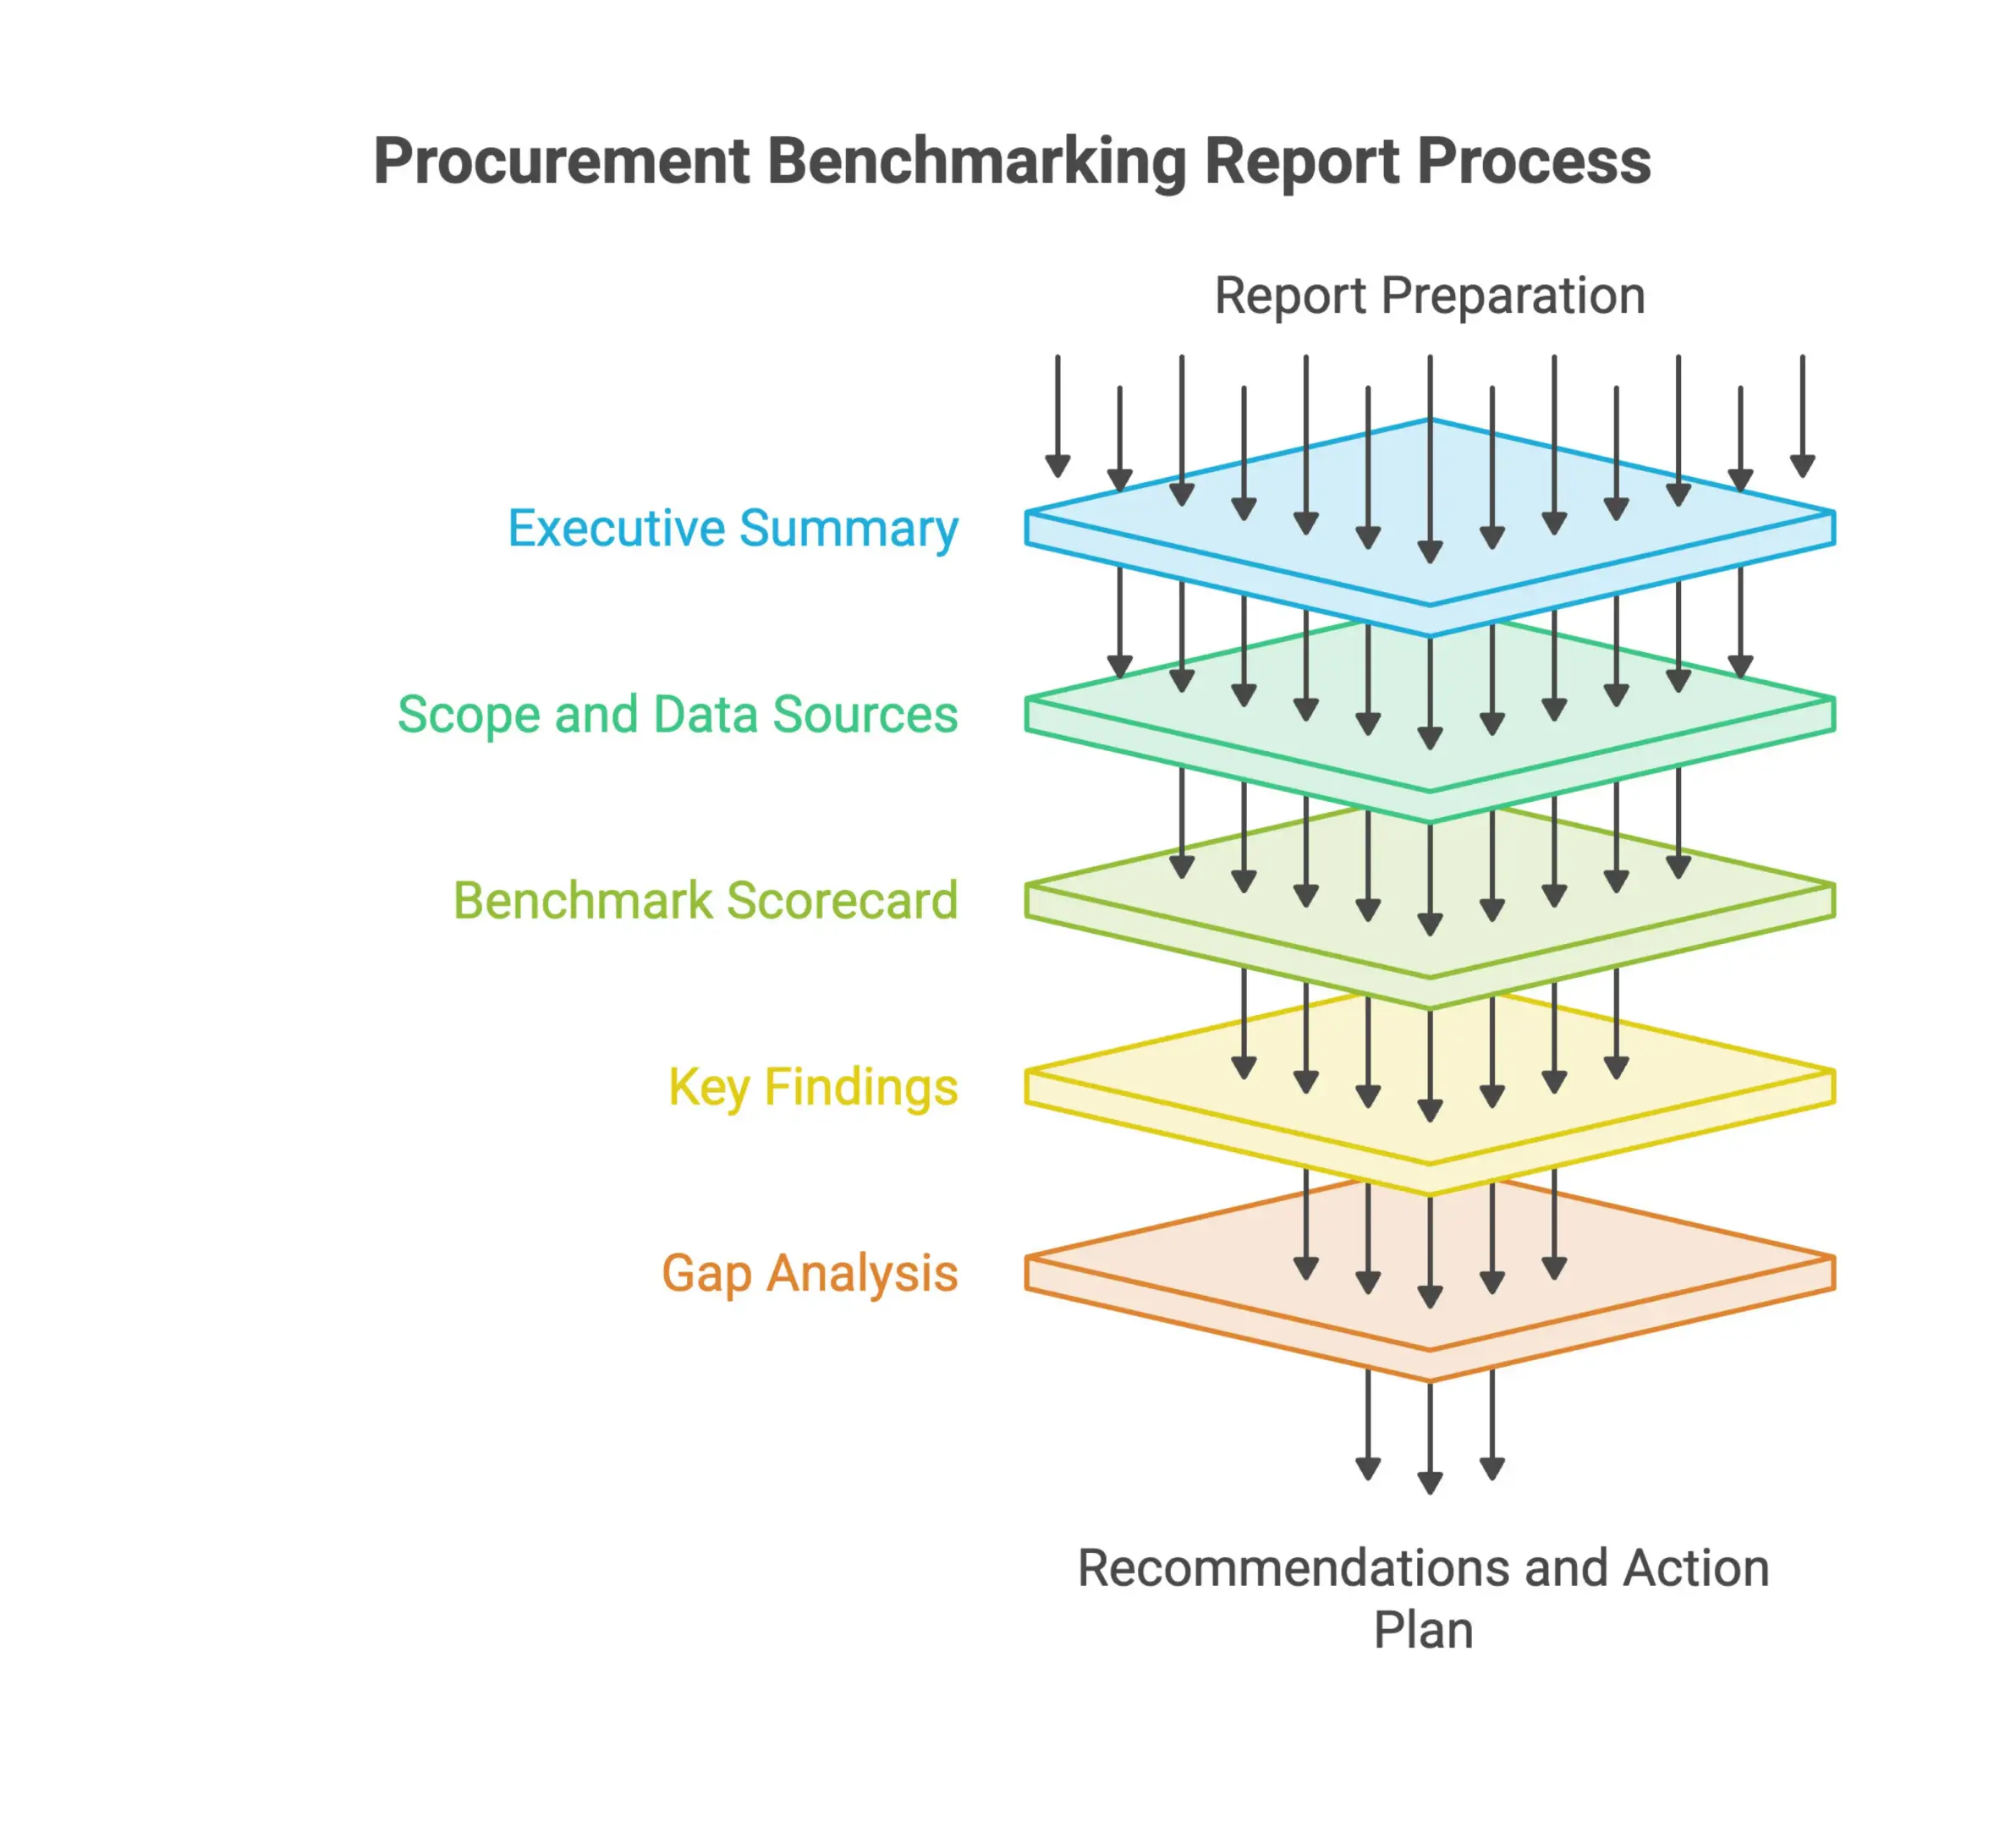
At a minimum, the report should include:
- Executive summary: purpose, scope, key findings, and recommended next steps
- Scope and data sources: spend categories, suppliers, contracts, processes, time period, and benchmark sources
- Benchmark scorecard: current performance compared with internal baselines, peer data, market data, or industry standards, including governance metrics
- Key findings: where performance is strong, where it is weak, and whether governance metrics track maverick spend and compliance rates
- Gap analysis: prioritized gaps affecting cost, risk, delivery, quality, or business goals
- Recommendations and action plan: specific actions, priorities, owners, and follow-up points
The report also needs to be honest about its limits. Procurement data is rarely perfectly clean. Costs may need adjustment for scope, volume, region, timing, specification, currency, or contract structure before comparisons are meaningful. Metric definitions must also be consistent. On-time delivery or cost savings can mean different things in different systems unless the report defines them clearly.
As the OECD notes in its public procurement performance guidance, benchmarking works best when it is based on clear data and connected to the procurement function’s strategic objectives.
Key Metrics in a Procurement Benchmarking Report
Effective procurement benchmarking starts with choosing the right measures. Too many metrics can bury the message. Too few can hide the real problem. Most reports group metrics into cost, efficiency, supplier reliability, risk, and overall value.
Cost Savings, and Total Cost
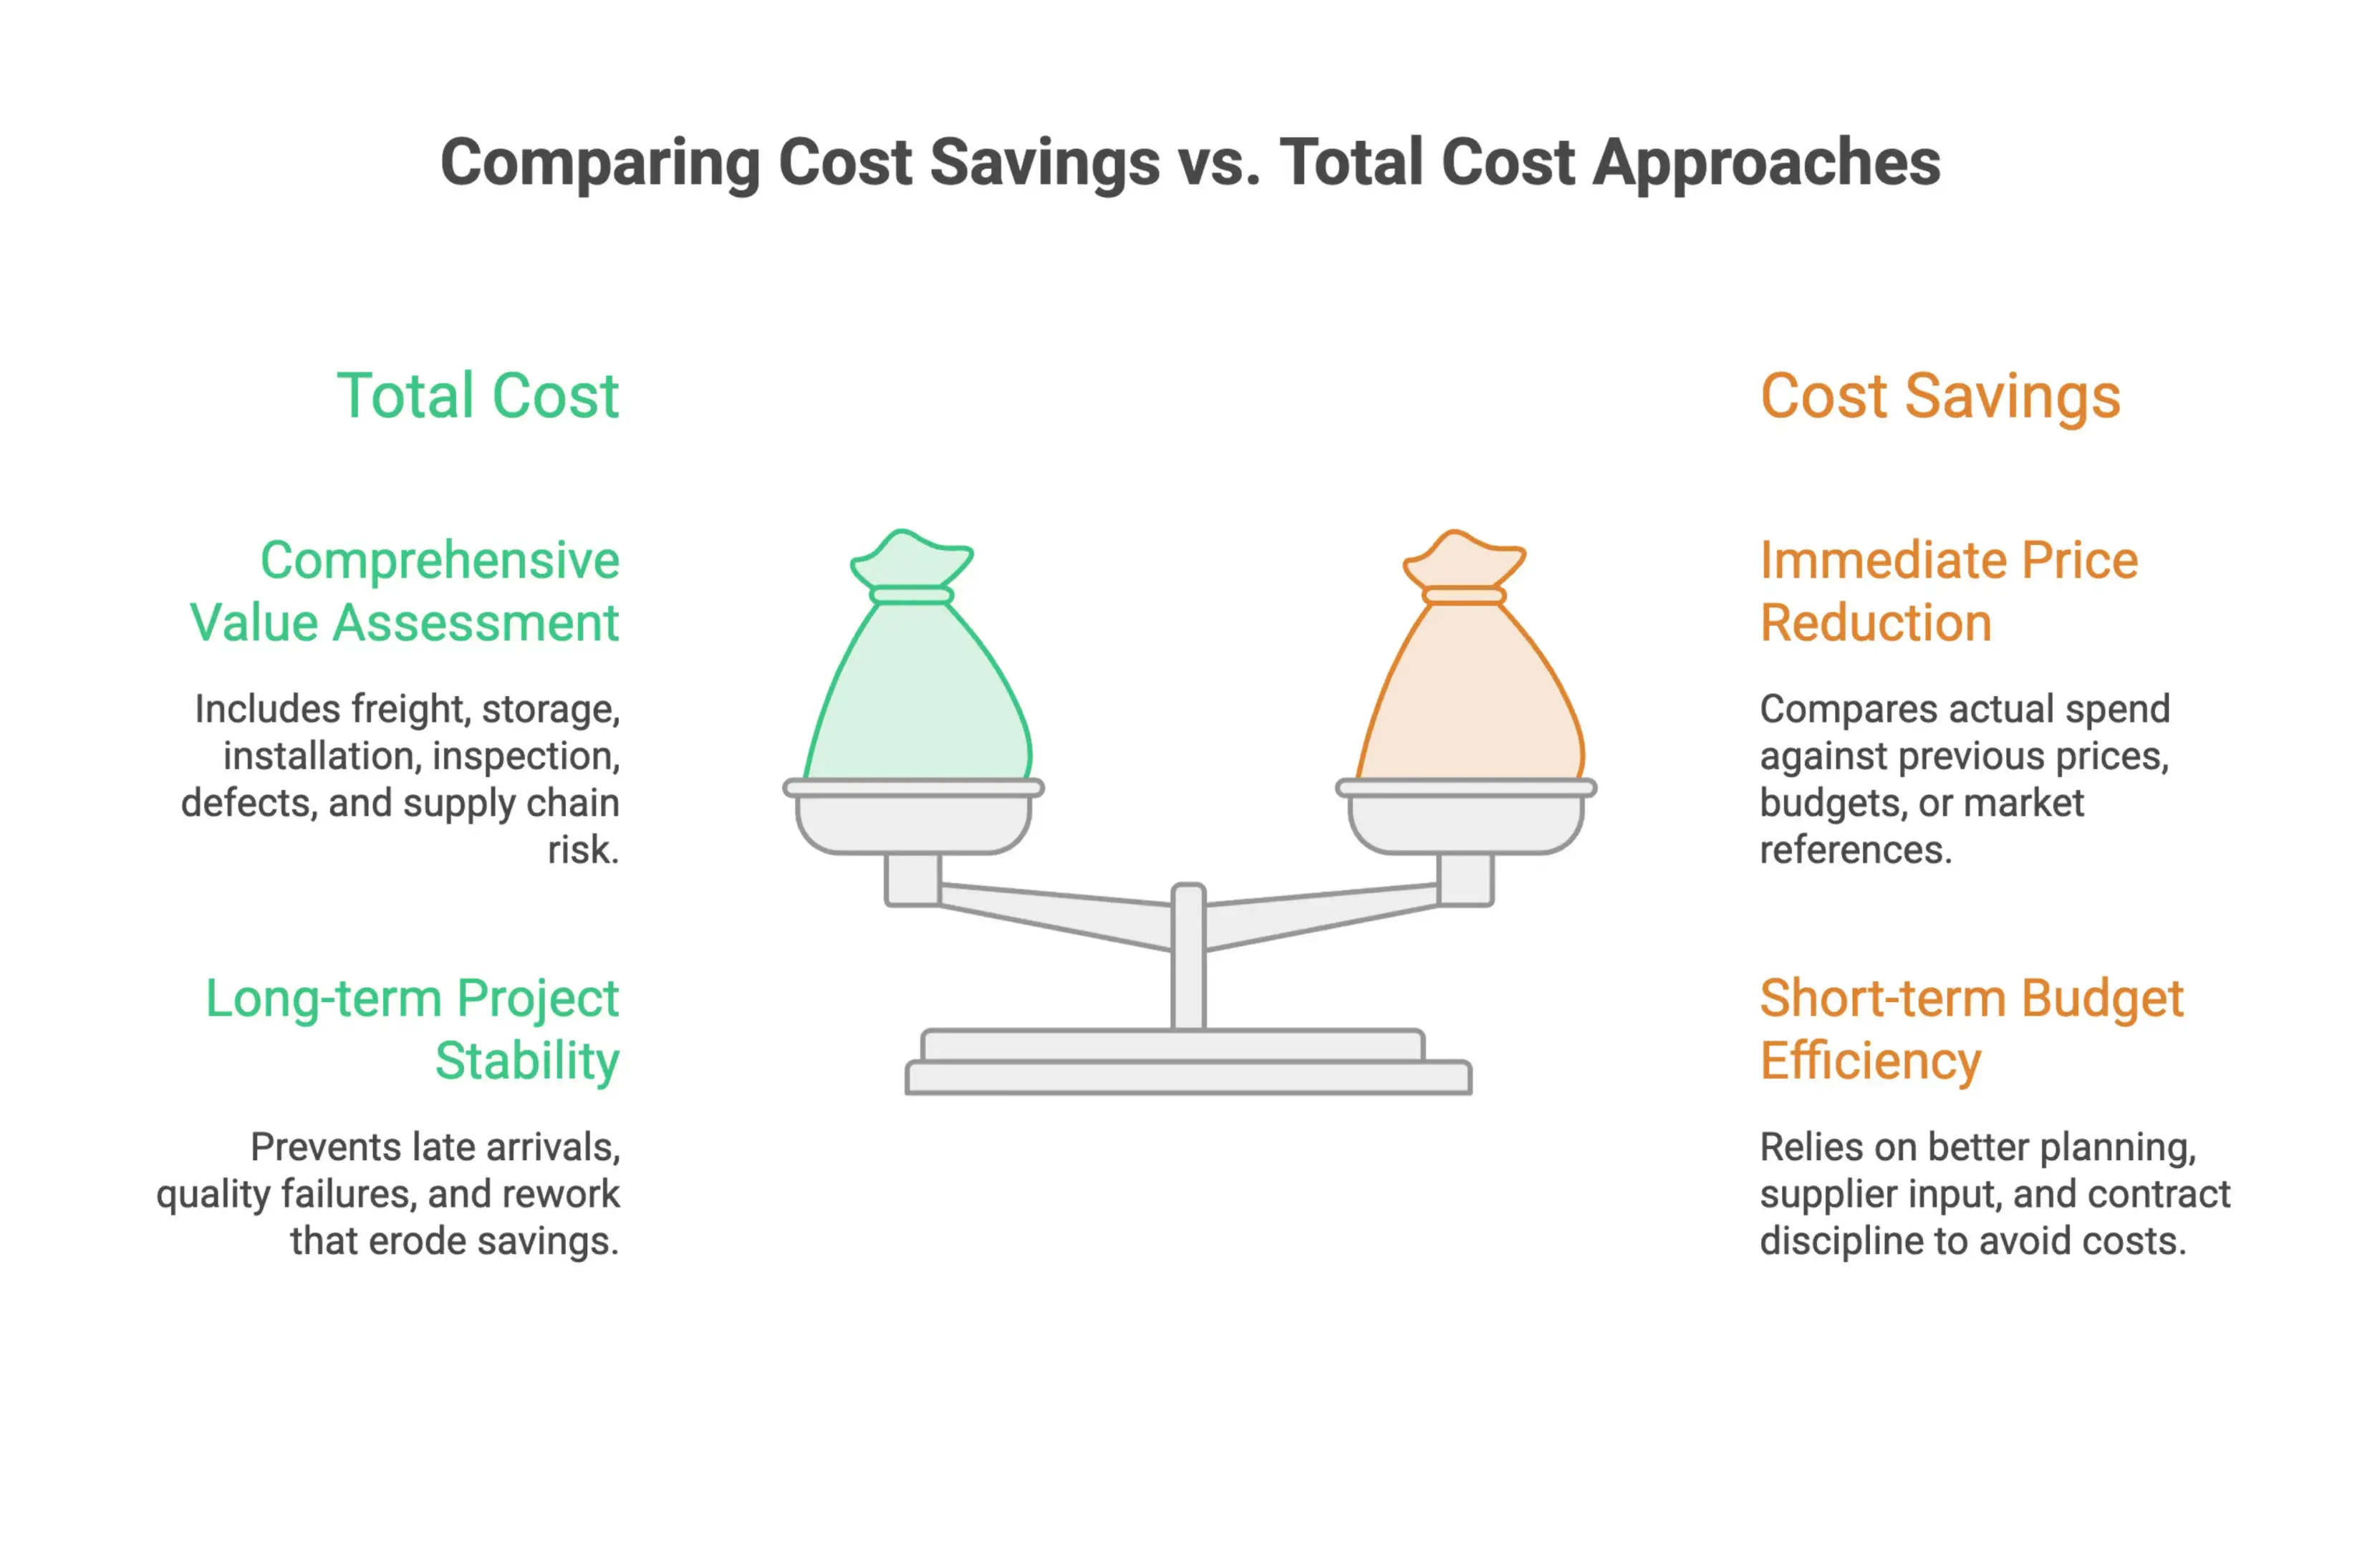
Cost savings and cost avoidance are often the first metrics people look for. For procurement leaders, 79% of CPOs prioritize cost savings in procurement. Cost savings usually compare actual spend with a previous price, budget, or market reference. Cost avoidance captures costs prevented through better planning, supplier input, demand control, or contract discipline.
Both can be useful, but a lower purchase price does not always mean a better outcome. If cheaper materials arrive late, fail quality checks, or cause rework, the project may lose the expected savings. Mature benchmarking therefore looks at total cost, not just the line item price.
Total cost can include freight, storage, installation impact, inspection, defects, change orders, lifecycle cost, and supply chain risk. In construction and engineering, procurement performance often appears later in the project as delay, disruption, or cost at completion.
Spend under management is another useful indicator. Best-in-Class organizations effectively manage over 90% of their spend, and when more spend is covered by approved contracts, category strategies, and procurement oversight, teams are usually better positioned to control cost and reduce maverick buying.
Process Efficiency and Supplier Performance
Process efficiency metrics show the effectiveness of how procurement professionals run the procurement operation. Common examples include requisition-to-purchase-order cycle time, processing cost per transaction, approval delays, purchase order throughput per procurement employee, and the percentage of purchase orders approved electronically. These measures help teams focus on where gaps exist in workflow performance.
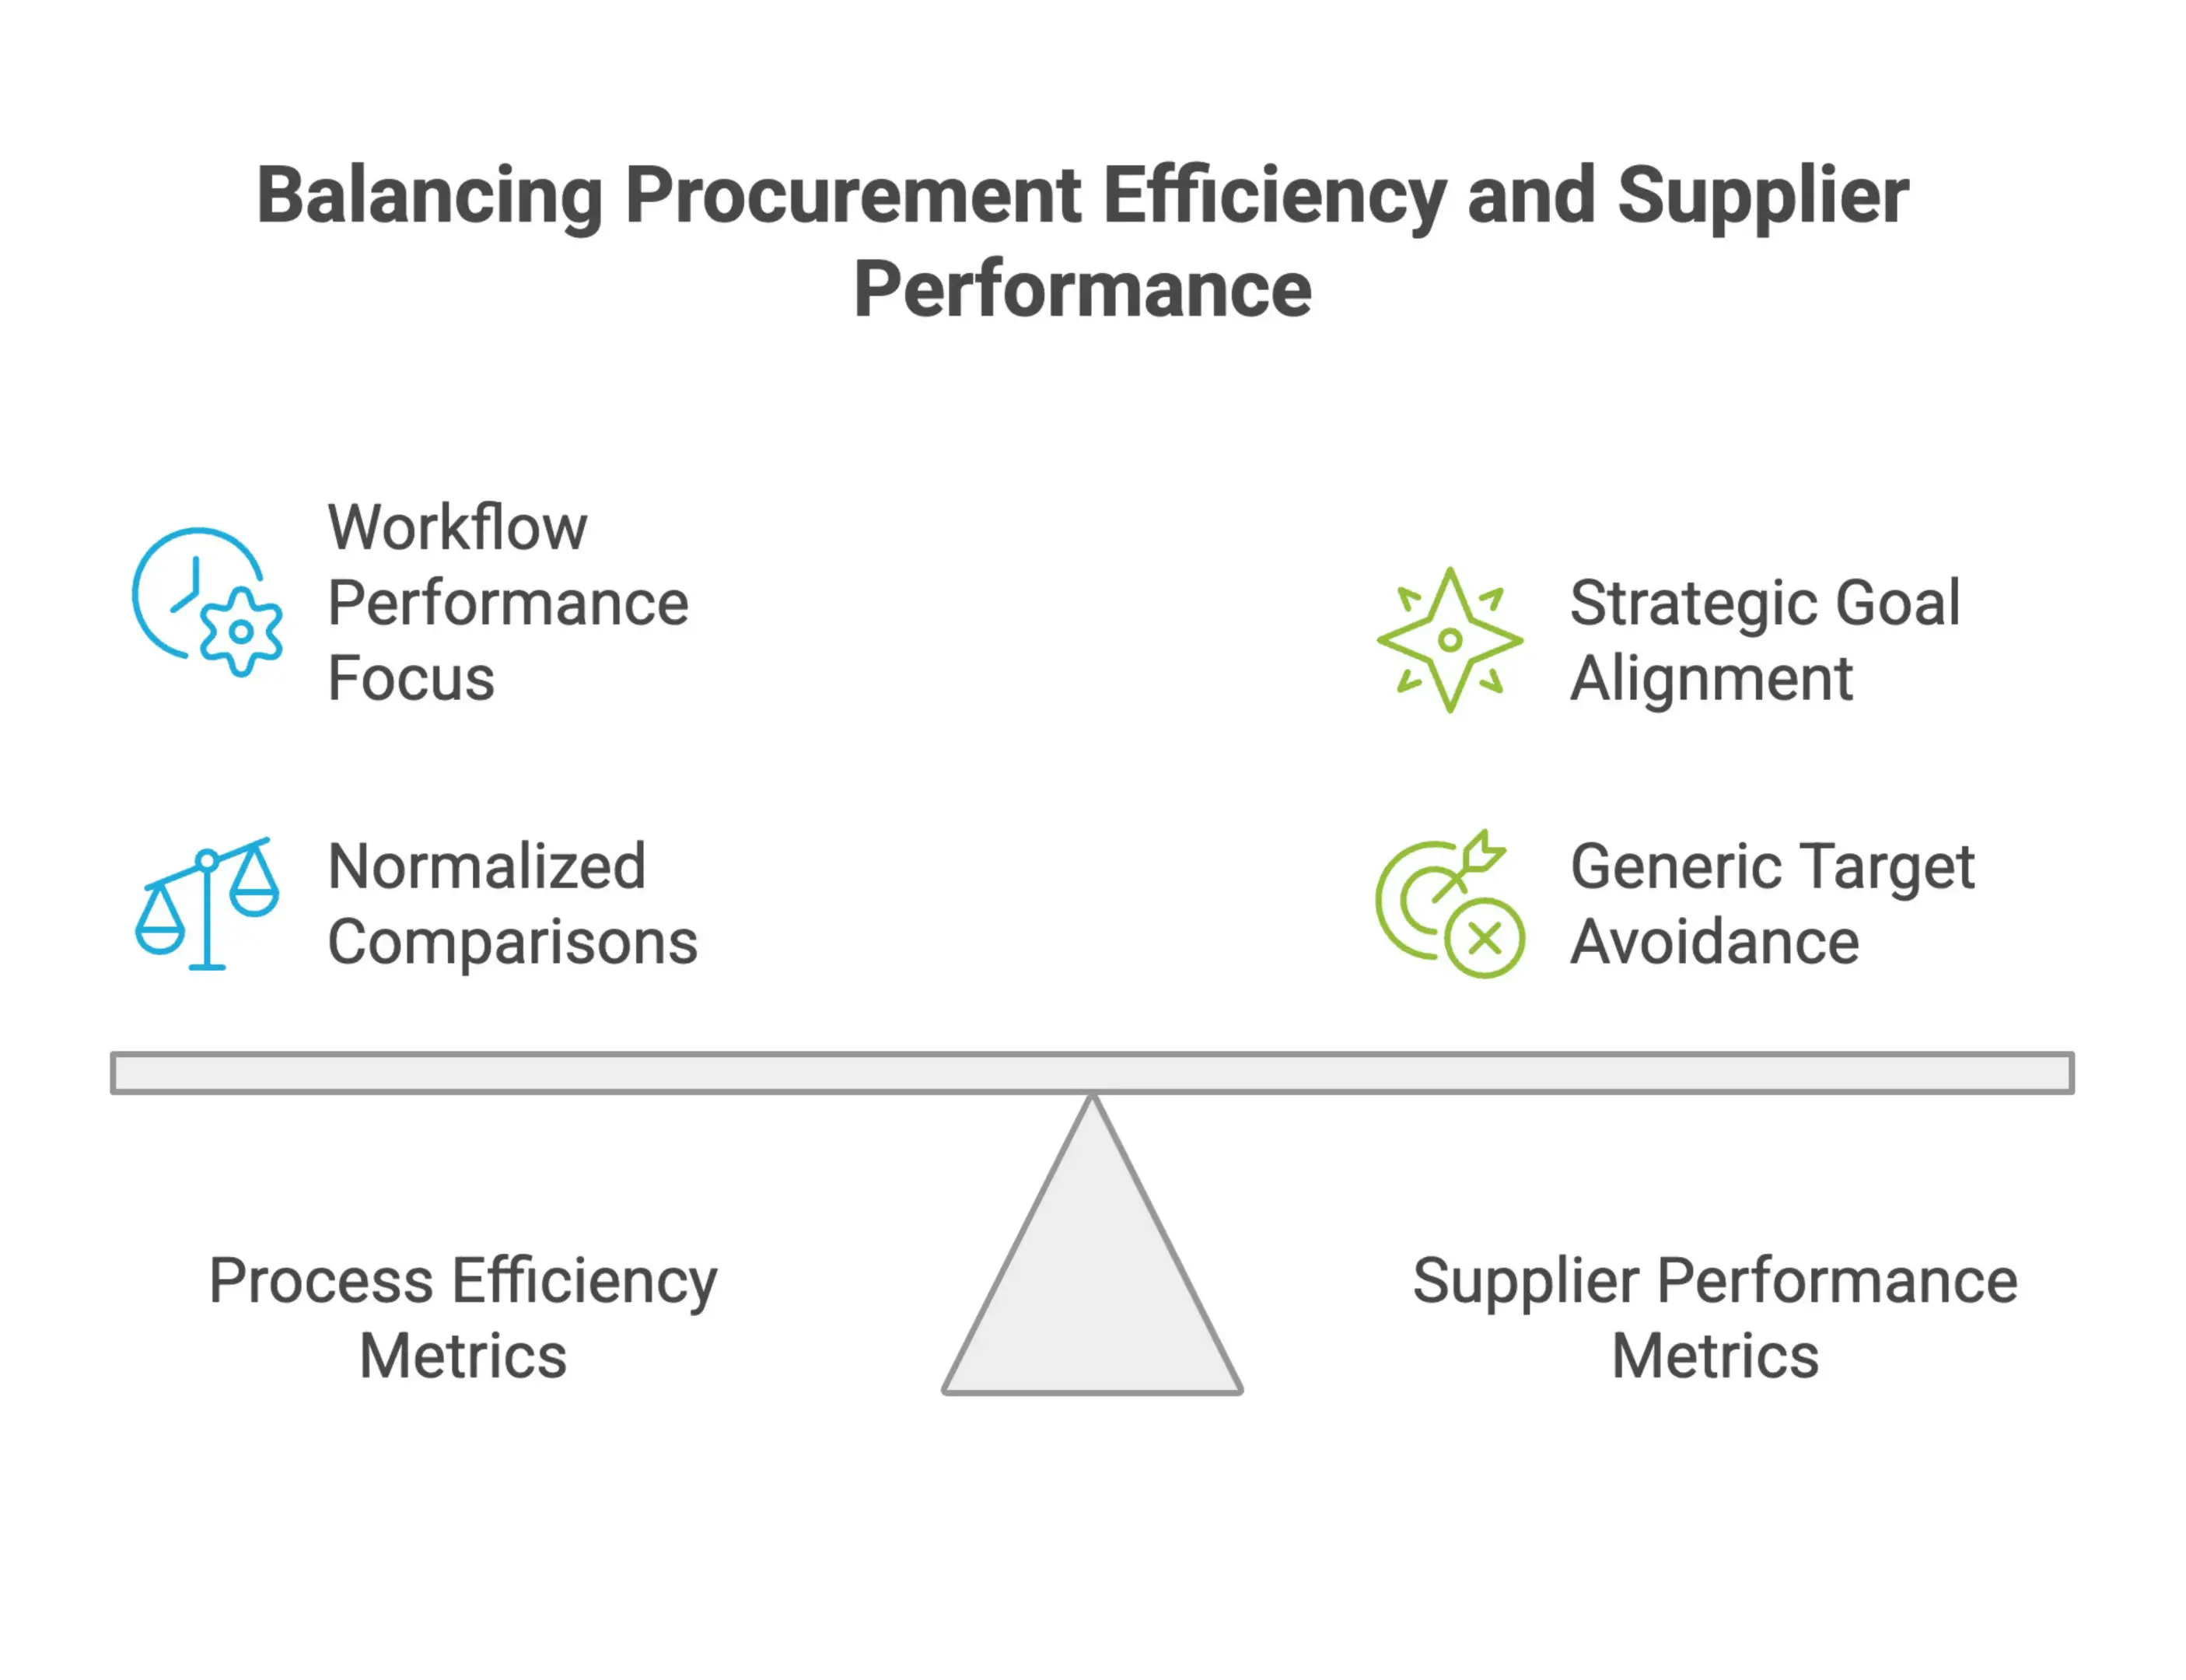
As APQC notes, these measures are often normalized by revenue, total purchases, or headcount so comparisons are fairer across organizations. A global EPC contractor, a public agency, and a specialist subcontractor may all buy materials and services, but their scale and operating models differ.
Supplier performance metrics measure how well suppliers deliver against expectations. Typical measures include on-time delivery, defect rates, lead times, responsiveness to changes, service quality, documentation accuracy, contract compliance, and supplier relationships. NIGP recommends tying these measures to strategic goals, so the metrics reflect what the organization actually needs rather than generic targets copied from another report.
How Procurement Teams Use Benchmarking Results
Benchmarking is essential for decision-making only if it changes decisions. Once the report identifies meaningful gaps, procurement teams need to turn the findings into an action plan with owners, timelines, and review points.
A category with above-market pricing may need strategic sourcing. A slow approval process may need workflow redesign or automation. Weak contract compliance may point to poor monitoring, unclear obligations, or the need to renegotiate terms.
Each recommendation should have a named owner, a realistic timeframe, and a measurable target. Otherwise, the report becomes another document in a shared folder rather than a tool for improvement.
Targets should also be realistic and tied to business objectives, because competitiveness depends on reflecting actual market conditions. Benchmarking is not about copying the best number in the market and assuming it is achievable next quarter. The right target depends on the organization’s size, maturity, systems, supplier base, risk appetite, and expected outcomes.
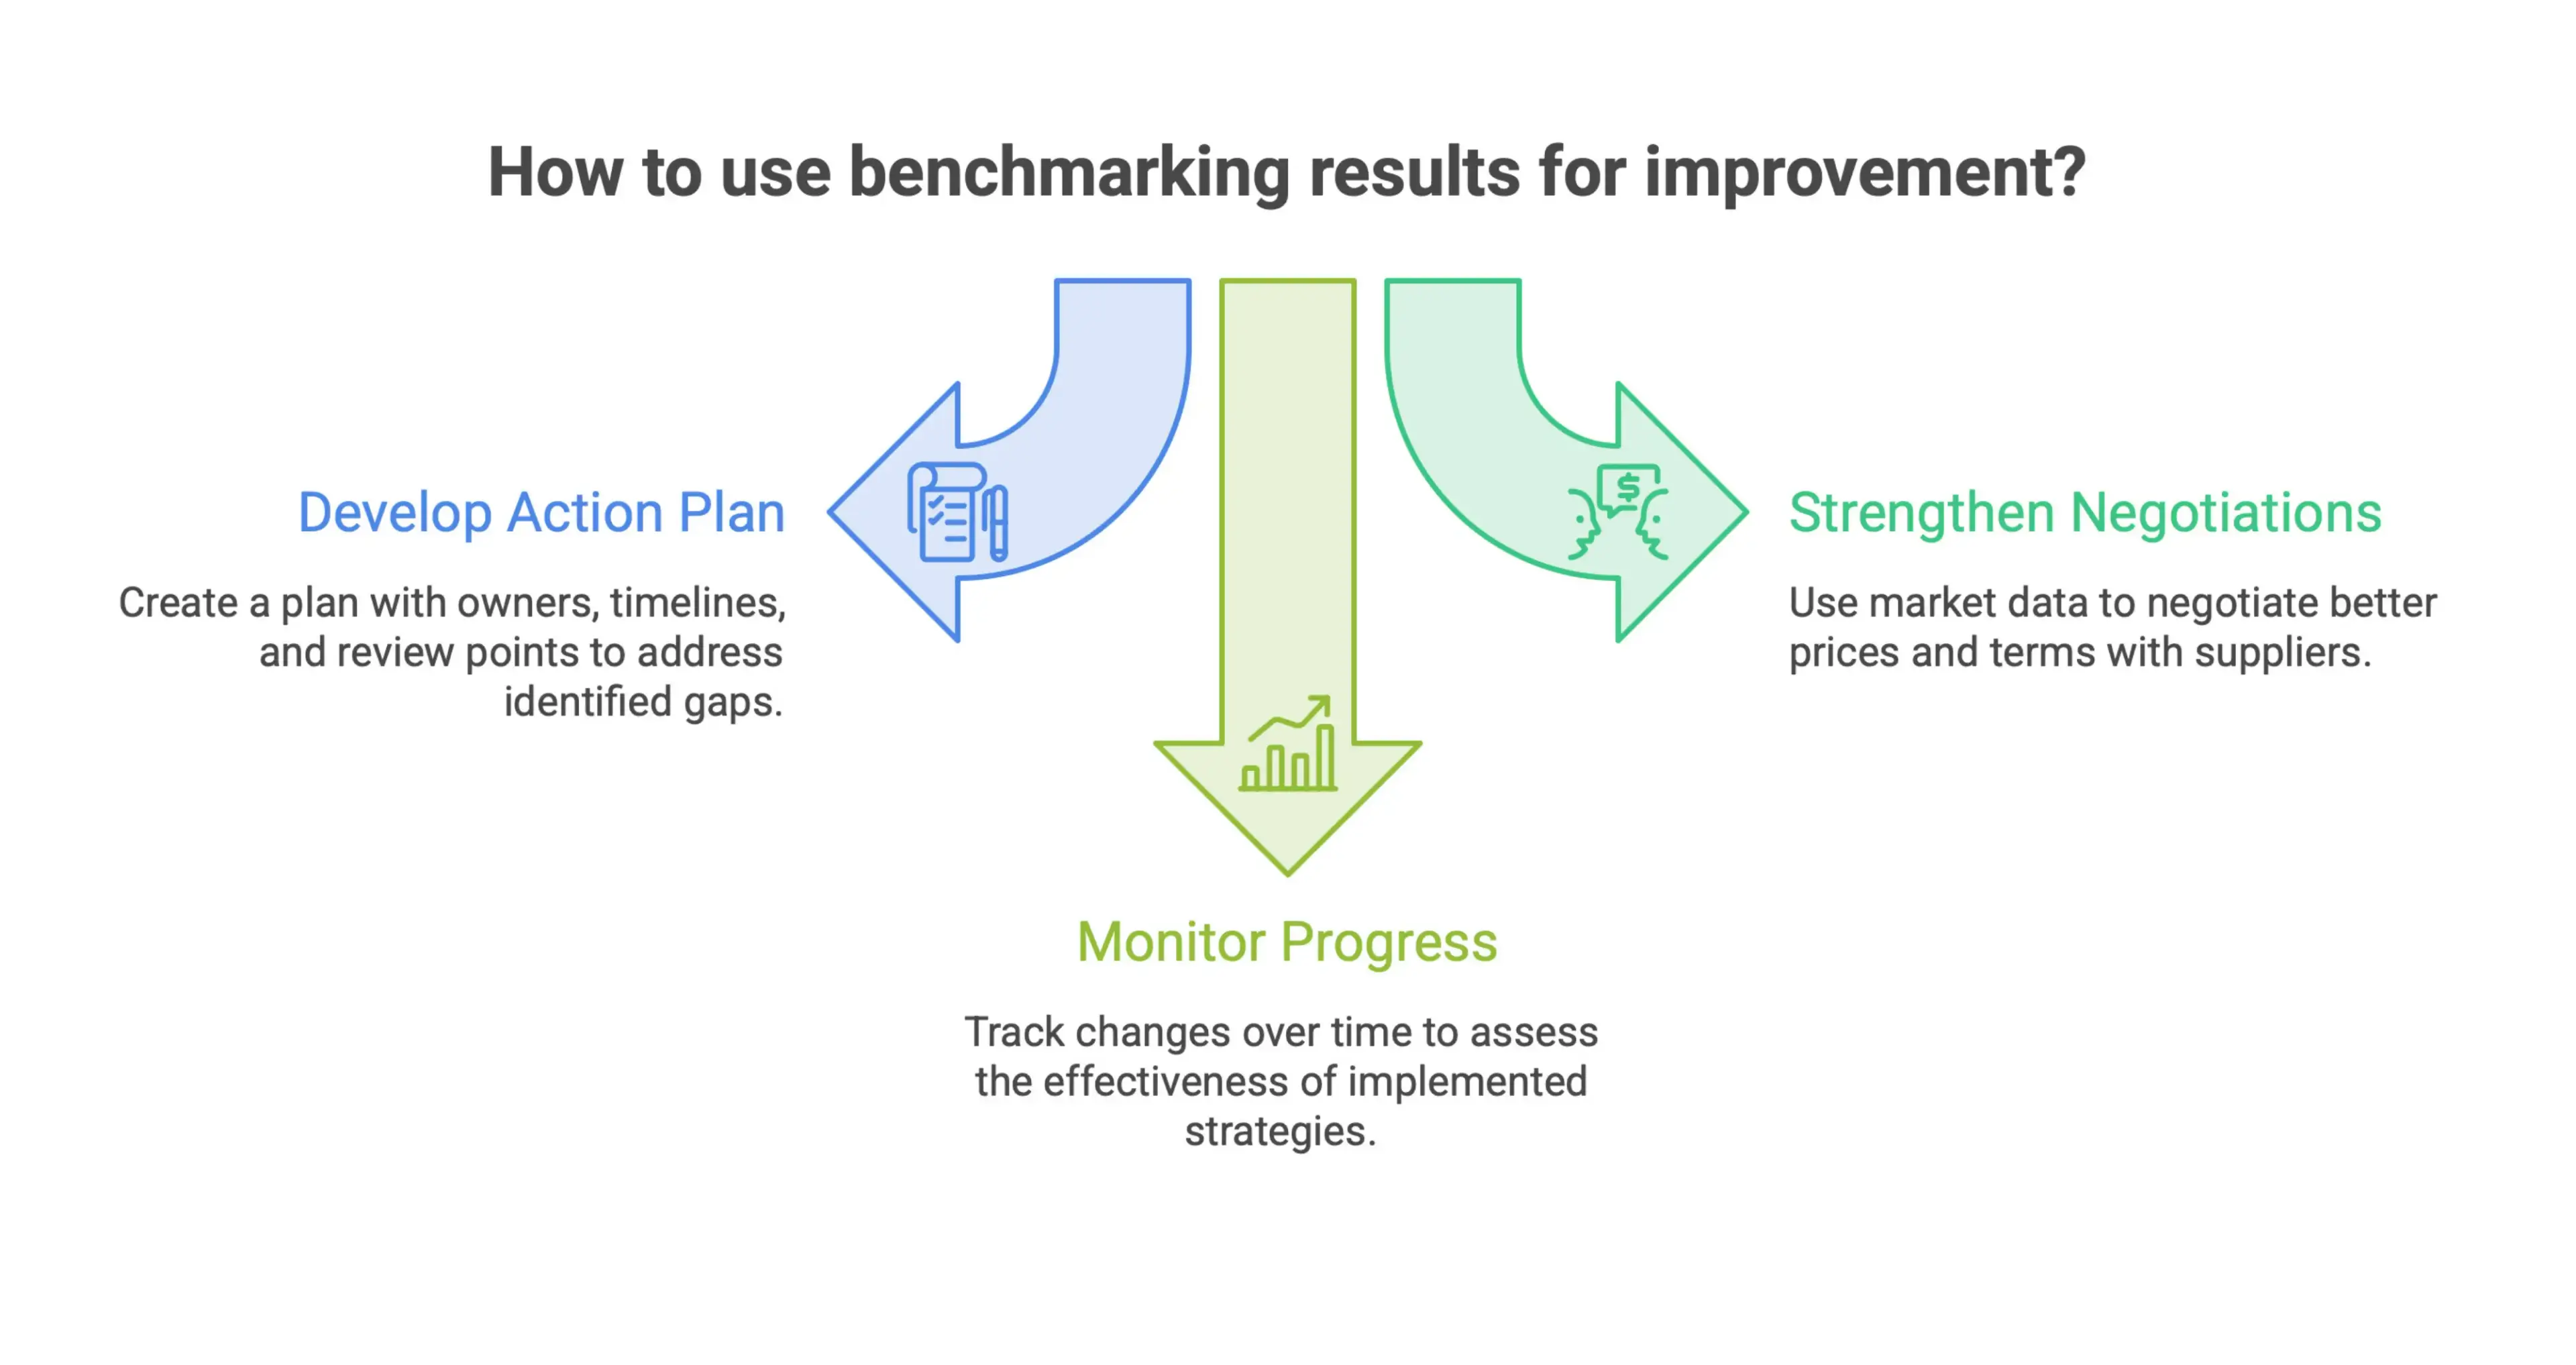
Benchmarking also strengthens sourcing and supplier negotiations. Procurement teams can refer to market pricing, delivery performance, quality data, and total cost indicators instead of relying on gut feel. Over $44 billion in purchasing data can support price competitiveness and help teams negotiate from a stronger position. Using benchmark data this way can also save money by improving commercial outcomes. If the data shows a supplier is consistently weak on delivery or quality, a lower price may not solve the issue. The better answer might be supplier development, dual sourcing, revised contract terms, or a different sourcing strategy.
When benchmarking is repeated consistently, it also shows whether procurement is improving over time. One report gives a snapshot. A series of reports shows direction.
Procurement Benchmarking in Construction and Project Delivery
In construction, engineering, and EPC environments, procurement benchmarking helps companies manage procurement decisions in complex project settings across bulk materials, subcontract packages, equipment suppliers, fabrication lead times, logistics costs, specialist services, and contract performance. The concept is the same as in other sectors, but the consequences can be sharper because procurement decisions are tied directly to schedule, site productivity, safety, and final account outcomes.
Purchase price is rarely the right yardstick on its own. Total cost may include transport to site, storage, installation effort, interface risk, delivery delays, defects, rework, warranty issues, and longer-term operating or maintenance cost. A low unit rate can look attractive during tendering, then become expensive once delay or quality problems reach site.
This is where normalization becomes critical, because the benefits depend on fair comparisons adjusted for region, project type, scope, specification, quantities, escalation, and timing. As RICS guidance on cost analysis and benchmarking makes clear, construction cost data must be adjusted for location and time before it can be applied to current or future projects. Benchmark databases and cost modelling platforms such as CosMO can help teams work with historical cost data, normalization, and comparable project information.
For project teams, the best procurement benchmarking reports connect the commercial view with the project view. They help estimators, cost engineers, quantity surveyors, procurement leads, and project controls teams understand not only what something costs, but why it costs that much and what risk sits behind the number. For a deeper look at sector-specific benchmarking methods, see this guide to cost benchmarking in construction.
Frequently Asked Questions
What is the difference between procurement benchmarking and cost benchmarking?
Procurement benchmarking looks at the wider procurement function, including sourcing efficiency, supplier performance, contract compliance, cycle times, risk, and total value. Cost benchmarking focuses more narrowly on comparing prices or cost levels. In project environments, the two often overlap because procurement decisions directly affect total installed or delivered cost. It is also useful to understand the difference between cost benchmarking and cost estimating, because benchmarking compares against reference data while estimating forecasts the likely cost of a specific project.
How often should a procurement benchmarking report be updated?
The right frequency depends on spend volatility, supplier risk, and business needs. Many teams review key metrics quarterly or annually, while high-value or fast-moving categories may need more frequent updates. The important point is consistency, because trends are only useful when tracked against the same definitions and baseline.
Ready to Take the Next Step?
If your team wants to turn procurement benchmarks into clearer sourcing, supplier, and project cost decisions, explore Nomitech’s full suite or get in touch.





Stay Up to Date
Subscribe to our Newsletter today and receive the latest updates, trends, expert insights, and exclusive offers tailored to your specific industry.