

What Is an Estimating-to-Benchmarking Workflow?
TL;DR: An estimating-to-benchmarking workflow turns early project assumptions into estimates that can be tested, refined, and defended. It combines structured estimating methods with historical and market benchmark data to improve confidence, catch outliers early, and create a repeatable feedback loop for better decisions.
What Estimating-to-Benchmarking Workflow Means
Early estimates are often asked to do too much before the project is fully clear. Leaders still need to approve budgets, submit bids, and commit resources, even when project scope is still shifting, data lives in different places, and project teams are working from different assumptions. That is usually where estimating starts to wobble. Not because the team is careless, but because a disconnected estimate is hard to defend on its own.
That is exactly why the estimating to benchmarking workflow matters. Tight timelines, expanding project complexity, and patchy historical data make it harder to know whether an estimate reflects real project conditions or just familiar internal habits. A structured process fixes that by linking estimate creation, benchmark validation, and revision into one process teams can repeat, review, and improve over time.
For organizations trying to reduce uncertainty and stand behind their numbers with more confidence, this approach creates a more controlled path forward. With the right methods, data, and tools such as CostOS and broader benchmarking platforms, teams can move from rough assumptions to benchmark-backed decisions. Here is what that looks like in practice.
At its simplest, an estimating-to-benchmarking workflow is a structured way to turn early assumptions into estimates you can actually trust. Instead of treating estimating as a one-off task, it creates a feedback loop. Teams build an initial estimate, test it against real performance data and benchmarking data, refine it, and validate it before major decisions are made.
For teams managing complex, high-value projects, that shift matters. Estimating becomes less about educated guesswork and more about a repeatable process backed by evidence. In project management, benchmarking provides the factual baseline that makes predictions about costs, time, and resources more realistic than gut feel.
Defining the Estimating to Benchmarking Workflow from Estimate Creation to Benchmark Validation
This workflow usually begins early in planning, when teams need a cost or effort baseline before the full scope is locked down. From there, it moves through a series of connected steps: building the first estimate, comparing it with historical data, spotting gaps or outliers, and checking the result against benchmark references.
Atlassian outlines a practical version of this in the way their teams approach project estimation. They use analogous estimating to set an initial baseline from similar past projects, combine that with bottom-up estimating from individual work packages, and document the assumptions behind each number so updates can be made clearly as new information comes in.
That documentation piece matters more than many teams think. It turns an estimate from a standalone figure into a traceable record of how the team got there. Once benchmarking data enters the process, it becomes much easier to see why certain figures make sense and why others do not. Benchmarking provides the why behind the numbers, which helps estimators justify costs against industry averages, historical data, and other reference points.
The validation stage is what closes the loop. By comparing early estimates with benchmarked performance data from similar projects or industry references, teams can judge whether their assumptions were realistic, where they may have over- or underestimated, and how to improve the next round. In practice, this is where structured estimating tools and benchmark libraries, including benchmarking software, can support a more consistent benchmarking process.
Why Project Benchmarking Matters for Executives, Sponsors, and Project Management
For executives and project sponsors, the real issue with early estimates is not accuracy alone. It is confidence. Budget approvals, resource allocation, and schedule commitments often happen before the full picture is available. So the quality of the decision making depends heavily on how much trust the estimate can carry.
Benchmark-backed estimates address that in a practical way. When an estimate has been checked against comparable project data, it becomes something leaders can defend, not just something they have to explain away later. In project management, benchmarking helps decision-makers understand how they compare with past projects, industry standards, and peer teams, so they can identify areas for improvement before risk turns into cost.
Gartner makes a similar point in software engineering performance. Their benchmarking diagnostic helps leaders compare results against industry peers so they can separate real improvement opportunities from noise. The same logic applies here. Without clear reference points, it is hard to tell whether an estimate reflects actual project complexity or just internal habits, optimistic assumptions, or legacy pricing logic.
For sponsors approving budgets, benchmark validation provides:
- A clear way to compare project scope and project cost with industry norms
- An early warning when estimates sit outside expected ranges before commitments are locked in
- More confidence when presenting numbers to boards, clients, or other stakeholders
- Better visibility into project health, cost performance, and likely business value
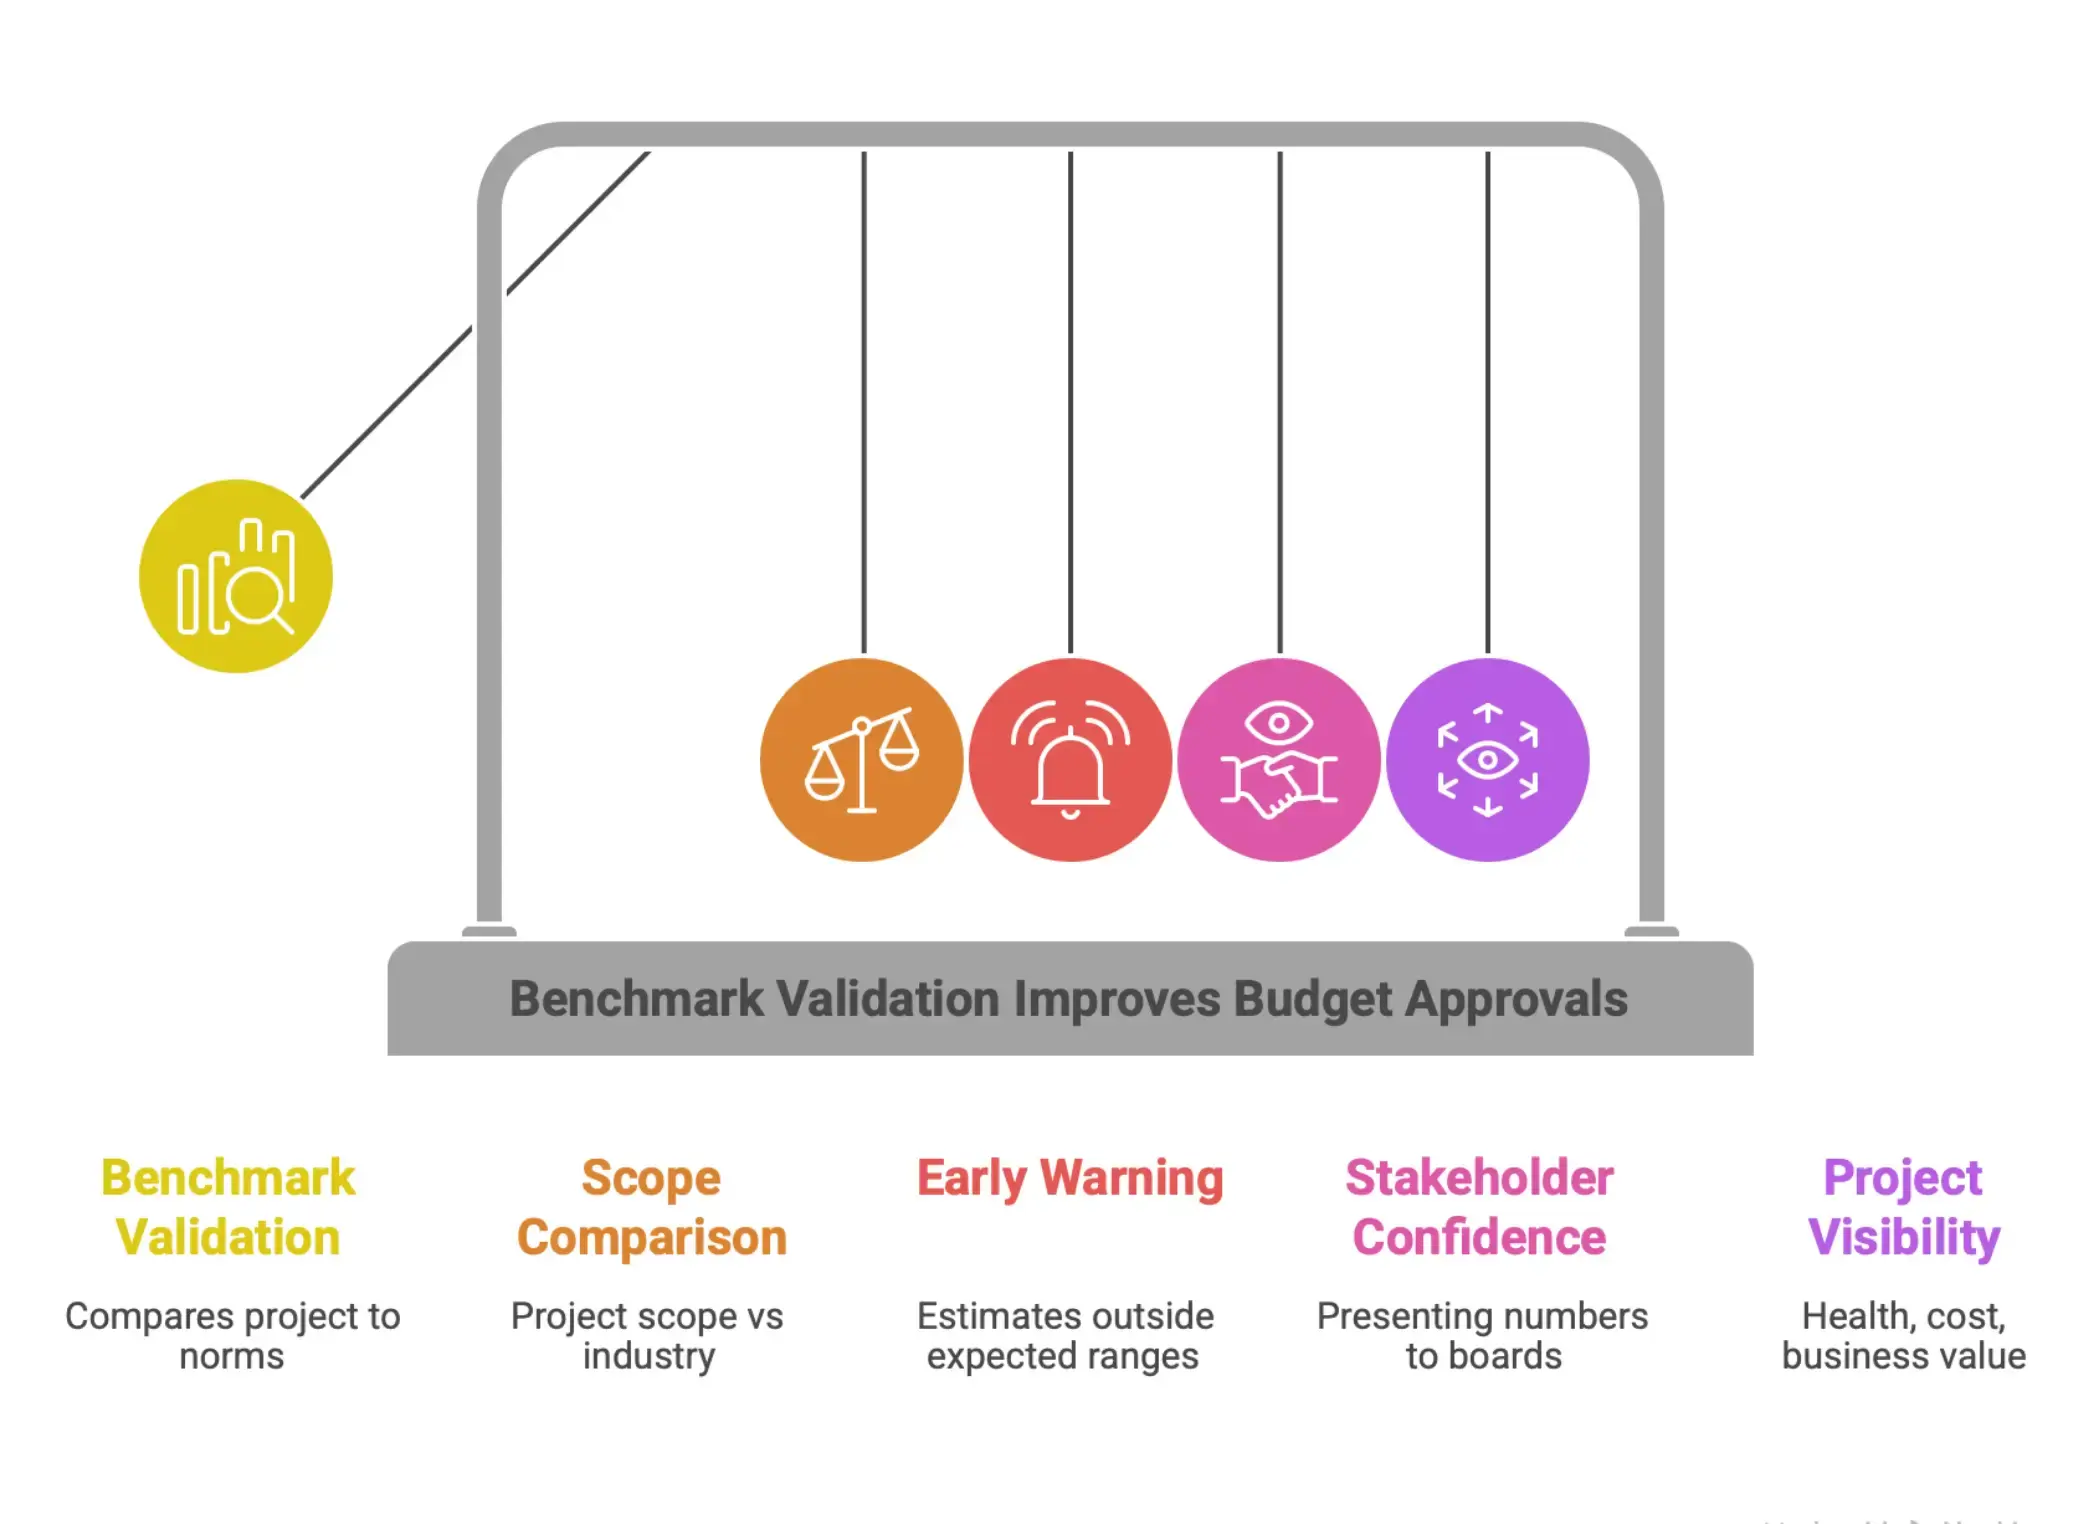
In the end, an estimating-to-benchmarking workflow helps organizations move away from gut-feel approvals and toward investment decisions backed by structure, context, and real project data. That strengthens stakeholder credibility and lowers the odds of over-promising and under-delivering.
Core Stages in the Estimating-to-Benchmarking Process
A strong estimating-to-benchmarking process gives teams a clear path from early uncertainty to an estimate they can defend. Each stage builds on the one before it, moving the project from rough sizing to approval, execution, and project performance tracking.
Start with Project Scope, Assumptions, and Sizing Inputs
Every credible estimate starts with project scope. Before anyone starts plugging numbers into a workbook or estimating system, the team needs to agree on what is actually being delivered, what constraints are in play, and which assumptions are shaping the estimate around labor, materials, schedule, and technology.
In software, functional sizing methods like IFPUG, Nesma, or COSMIC function points are often used to turn scope into something measurable. According to ISBSG, that sizing step is the foundation of the whole workflow, since effort, cost, and delivery benchmarks all tie back to functional size.
In construction, sizing is based on physical quantities. That might mean cost per square foot, labor hours per unit, or material quantities tied to a functional output. As noted by SMA Estimating, these inputs support parametric estimating during design development, when teams need structure even though the design is not fully detailed. Parametric modeling uses historical ratios to calculate new estimates based on variables such as cost, duration, or production rates.
This is also the point where assumptions need to be written down, not just discussed in meetings. If the scope shifts or an assumption turns out to be wrong, the estimate has to shift with it. Good documentation makes that rework faster, cleaner, and much easier to explain later. It also sets up better data collection because the team is already standardizing what information gets captured and how it is stored.
Build the Initial Estimate Using One or More Estimation Methods
Once scope and sizing inputs are in place, the team can build the first estimate. Strong estimating teams rarely rely on just one method. More often, they combine a few approaches, compare the results, and use the differences to test whether the logic really holds up.
Atlassian points to analogous estimation as one common method. It uses similar past projects as a starting point. Bottom-up estimation works differently, building the total from individual work packages. Running both in parallel gives teams a better read on whether the estimate is realistic, and it makes later adjustments easier because the assumptions behind each method are already visible.
In construction, parametric estimating gives teams a structured way to build early estimates from known cost drivers. SMA Estimating notes that during design development, this approach typically lands within plus or minus 15 to 25 percent. That is a practical range for early-stage work, when enough is known to model the job but not enough to price every detail.
In software, teams often apply productivity rates to functional size to estimate effort and staffing. Using an example of a mobile app MVP sized at 800 to 1,200 function points, built in Java with Agile delivery, ISBSG data from 512 projects shows a median Project Delivery Rate of 7.9 hours per function point. That translates into roughly 5,440 to 11,280 hours of effort and a team size of about 5.7 to 11.8 FTE over a six-month delivery period.
This is also the stage where many teams start using cost estimating software to standardize inputs, apply rate libraries, and keep version control tight. Systems like Nomitechcan add that structure without forcing teams into a rigid one-size-fits-all workflow. In project management terms, this is where recognized performance standards begin to shape the likely costs, time, or resources required for a new project.
Benchmark the Estimate Against Historical Data, Market Data, and Project Benchmarking References
An initial estimate is just the starting point. To know whether it is credible, teams need project benchmarking.
Benchmarking means comparing your estimate against actual performance data from similar projects, either from your own records or from external industry sources. The goal is straightforward: you want to know whether your numbers sit in a normal range or whether they point to a likely problem with cost, effort, schedule, or staffing. Historical data is crucial here because it forms the basis of estimate for new work and gives the benchmarking process something real to test against.
QSM describes this through its SLIM Suite, where historical benchmarks are used to sense-check estimates by measuring how far they deviate from established averages. That kind of deviation analysis helps expose estimates that are too aggressive or too heavy, especially when staffing levels, schedules, or cost assumptions fall outside expected norms. QSM also stresses that software size has to be accounted for, otherwise the comparison is not meaningful.
The same principle applies in engineering and the construction industry. A large processing plant should be benchmarked against comparable plants, not smaller and simpler facilities. If the reference class is off, the benchmark may look precise, but it will not tell you much. One of the main common benchmarking challenges is achieving data consistency when comparing projects with different scopes, methods, team sizes, or delivery models.
Internal benchmarking adds another layer that outside datasets cannot fully provide. It reflects how your own teams actually perform, how your suppliers price work, and how projects have historically moved through your delivery model. External benchmarking adds value by showing how your results compare with competitors, industry peers, and industry standards. Competitive benchmarking can be especially useful when organizations need to test whether an estimate is truly in line with the market rather than just in line with internal habits.
This is often where estimate validation starts to get much stronger. Especially when historical project data is organized well, teams can move past gut feel and compare against real delivery patterns. In strong project management environments, benchmarking compares current metrics against chosen benchmarks so performance gaps can be analyzed and the significance of variances can be understood, not just spotted.
Refine, Approve, and Operationalize the Benchmarked Estimate for Project Cost Control
Benchmarking rarely ends with a clean approval on the first pass. More often, it surfaces inconsistencies, weak assumptions, or areas where the estimate needs more work. That is not a sign the process failed. It is exactly what the process is meant to catch.
After benchmarking, teams typically revisit assumptions, update scope-level costs, and close the gap between the estimate and observed performance data. Once the estimate lines up with benchmark expectations, it can move into formal review and approval. At that point, stakeholders are not just approving a number. They are approving the logic and evidence behind it. Benchmarking acts as a validation tool here, flagging potential risks when a new estimate is significantly lower than established benchmarks.
Autodesk emphasizes the value of connected estimating systems and a shared source of truth, especially at this stage when handoff errors and missing data can undermine confidence. Their approach also highlights continuous improvement through feedback reviews, where actual field performance is used to update templates, libraries, and estimating practices over time. That matters because every finished project should make the next estimate stronger.
Once approved, the estimate needs to be put to work. That means turning it into budgets, resource plans, schedule targets, and control baselines the project team can actually manage against. From that point on, the estimate is no longer just a planning exercise. It becomes the financial and operational baseline used to measure real project performance.
For teams working at scale, this operational step is where consistency matters most. If the estimate, benchmark, approval record, and control budget all live in disconnected files, small errors have a way of multiplying. A connected estimating environment helps keep those decisions traceable from the first estimate to the final outcome. That traceability also supports transparency in benchmarking data, which is essential for monitoring progress and keeping business units aligned.
Best Estimation Methods to Use Before Benchmarking
Benchmarking is only as good as the estimate behind it. If the numbers are based on rough guesses or loose assumptions, any comparison with industry data will send you in the wrong direction. The methods below are the ones teams use most often to build estimates that hold up under benchmarking, and each one fits a different project stage, scope maturity, or delivery model.
Analogous Estimating for Fast Early-Stage Planning
When a project is still taking shape and scope detail is thin, analogous estimating gives you a practical place to start. It uses historical data from similar projects to set an initial baseline for cost, effort, or schedule.
As Atlassian explains, the idea is simple: use what you already know from comparable work to set realistic expectations before detailed planning is available. That makes it useful when stakeholders need an early budget number quickly, or when the job closely resembles something the team has already delivered.
What makes this method useful for benchmarking is not just the estimate itself. It is the record behind it. Teams should document the assumptions clearly, including which past project was used as the reference and how close the match really is. That gives you something you can trace, test, and improve later when you compare it with benchmarking information.
Used well, analogous estimating is a strong starting point. It is not the final word. As scope becomes clearer, it should be backed up with a more detailed method.
Bottom-Up Estimating for Higher Confidence in Detailed Scopes
When the scope is defined and the estimate needs to hold up under scrutiny, bottom-up estimating is usually the best option. Instead of starting with a high-level comparison, it builds the total estimate from the ground up by pricing and quantifying individual work packages.
Atlassian describes this as estimating each component separately and then rolling everything up into a total. The result is more detailed, easier to defend, and much better suited to serious benchmarking.
That detail matters. With a bottom-up estimate, you are not limited to checking whether the total project cost looks high or low. You can benchmark labor, materials, disciplines, systems, or specific line items and see exactly where the gaps are. For estimators and EPC teams, that is where the real value shows up. You can spot what is driving variance instead of just seeing that variance exists.
The tradeoff is time. Bottom-up estimating takes more effort and depends on solid scope definition. It works best once the project is stable enough to break into meaningful packages, usually during detailed design or pre-execution planning. In systems like Nomitech’s cost estimating environment, this level of structure also makes it easier to carry estimate data forward into benchmark checks and later estimate revisions.
Parametric Estimating for Scalable Project Cost and Productivity Modeling
Parametric estimating links cost or effort to measurable project drivers. Instead of treating the project as one lump sum, it applies rates or factors to known quantities such as cost per square foot, labor hours per unit, or material quantities per functional unit.
In construction, SMA Estimating notes that parametric models built around factors such as equipment utilization and material quantities per functional unit can reach accuracy in the range of plus or minus 15 to 25 percent during design development. That is often good enough to support early benchmarking, especially when detailed design is not ready but decision-makers still need credible numbers.
One of the biggest strengths of this method is consistency. Once you have a solid parametric model for a given asset type, facility type, or market, you can apply it across multiple estimates in a repeatable way. That is exactly what benchmarking depends on: comparable inputs, repeatable logic, and clear assumptions.
For benchmarking, calibration is everything. The factors in the model should be grounded in real project performance, not just internal rules of thumb. Industry-based rates make the comparison much stronger, and internal historical data can sharpen it further. When teams maintain these models properly, parametric estimating becomes a reliable bridge between early planning and more detailed estimate development.
Functional Size and Rate-Based Estimating for Software Delivery
Software projects are different. The work is real, but the units are not physical, which makes estimating harder if you rely only on story counts or broad team assumptions. Functional size measurement solves part of that problem by sizing software scope in a standardized, technology-independent way. From there, teams can apply benchmark rates from industry datasets.
ISBSG outlines a workflow that starts with functional sizing using standards such as COSMIC, IFPUG, or Nesma function points, then applies benchmark rates based on actual project data. Common metrics include Project Delivery Rate in hours per function point, cost per function point, and delivery speed in function points per month.
ISBSG also gives a practical example. A mobile application MVP sized at 800 to 1,200 function points, built in Java using Agile methods for a retail use case, is benchmarked using a median PDR of 7.9 hours per function point from 512 comparable projects. That produces an effort range of 5,440 to 11,280 hours, which translates to roughly 5.7 to 11.8 FTE over six months.
Why does this approach work so well for benchmarking? Because it separates two things that often get blurred together: scope and rate. Functional size gives you an objective way to measure what is being delivered. The benchmark rate turns that size into expected effort or cost based on real-world outcomes. That separation makes the estimate easier to explain, easier to compare, and easier to trust. It is also one reason software companies increasingly rely on benchmark datasets and project management discipline rather than broad assumptions alone.
How Benchmarking Improves Estimate Accuracy
Estimates built only on internal assumptions have a blind spot baked in. Without an outside reference, it is hard to tell when a number is reasonable and when it is already drifting off course. Benchmarking fixes that by tying estimates to real project data. It exposes weak assumptions early, before they turn into budget overruns or schedule slips.

That applies whether you are sizing a software project or planning a major capital build. Once you can compare your estimate against validated peer and industry data, the conversation changes. You move from defending a best guess to standing behind an estimate with evidence.
Using Historical Data and Industry Data to Validate Effort, Cost, and Schedule
One of the most practical ways to benchmark is to test the core inputs of an estimate before anyone approves it or commits to it.
In software estimation, ISBSG provides a clear framework for doing exactly that. After measuring functional size with methods such as IFPUG, Nesma, or COSMIC function points, estimators can use ISBSG benchmark data to check key metrics like Project Delivery Rate in hours per function point, cost per function point, and delivery speed in function points per month.
Take a mobile app MVP sized between 800 and 1,200 function points, built in Java with an Agile delivery model for the retail sector. Based on 512 comparable projects, the median PDR is 7.9 hours per function point. That gives you an effort range of 5,440 to 11,280 hours and a team size estimate of 5.7 to 11.8 FTE across a six-month schedule. That is not just estimator judgment. It is a benchmark grounded in actual outcomes, which makes the estimate much easier to justify.
At the organizational level, Gartner offers its Software Engineering Leader Effectiveness Diagnostic, which produces custom benchmarking reports that help teams compare engineering performance against peers. That kind of view is useful when you are trying to separate real improvement opportunities from normal variation in project metrics.
Taken together, these benchmarks make estimate validation far more concrete. The question is no longer "does this feel right?" It becomes "does this align with what similar projects actually delivered?" Benchmarking helps organizations compare themselves with similar organizations, and even where those organizations sit in different industries, the right metrics can still surface useful lessons.
Identifying Estimate Deviations and High-Risk Scenarios Early Through Project Performance Metrics
Benchmarking does more than confirm that an estimate looks sound. It also shines a light on the ones starting to drift away from reality.
QSM's SLIM Suite takes a structured approach by measuring how far an estimate deviates from historical norms. If a project’s schedule, staffing plan, or cost estimate falls outside the expected range, that gap is treated as a risk signal, not just an interesting number. Just as important, the method is strict about benchmark quality. Software size has to be part of the comparison, so teams are not matching projects in the abstract but comparing like with like.
That kind of deviation analysis works as an early warning system. Instead of finding out halfway through delivery that the job was understaffed or the timeline was unrealistic, teams can catch the issue during planning, when there is still time to adjust scope, sequence, or resources.
For teams working in systems like CostOS, bringing benchmark-based deviation checks into estimate reviews adds useful structure. It gives reviewers a clearer way to challenge outliers and lowers the odds that obvious risks slip through because a manual review missed them. In project management, performance gaps should be analyzed against selected benchmarks so teams can decide whether a variance is minor, material, or a sign that the estimate needs rework.
Improving Forecast Confidence with Historical Data, As-Built Results, and Cost Performance
The strongest benchmarks come from completed projects, not projected ones. As-built data shows what actually happened, including production rates, cost variance, and schedule slippage, and then feeds those lessons back into the next estimate.
InEight applies this directly in capital construction estimating. Its benchmarking process uses historical and as-built data to sharpen estimate inputs and improve production-rate reliability through AI and regression analysis. It also normalizes data so comparisons across projects are meaningful, then layers in variance analysis and auditability so estimators and reviewers can trace how values were developed and how they compare with historical performance. KPI tracking is built into the workflow, which means trends stay visible over time instead of disappearing into closeout files.
The value compounds. Every completed project strengthens the benchmark dataset. Better benchmark data leads to tighter forecast ranges, which reduces the uncertainty that often pushes contingency higher than it needs to be. Over time, that builds more confidence in the estimate itself, not just inside the estimating team, but also with owners, executives, and financiers who need to trust the numbers before they approve funding. Continuous improvement in estimating depends on feeding actuals back into the benchmarking database so future projects benefit from what the last one taught you.
Industry Examples of Estimating-to-Benchmarking Workflow
The estimating-to-benchmarking workflow is not tied to one industry. Whether you are sizing a software product, preparing a construction bid, or planning a major capital project, the logic stays the same: build the estimate first, then test it against credible benchmark data before locking in decisions, budgets, or resources. The examples below show how that plays out in three very different settings.
Software Projects: From Function Points to Delivery-Rate Benchmarks
In software development, one of the most disciplined versions of this workflow starts with functional sizing. Teams define scope using methods like IFPUG, Nesma, or COSMIC function points, then use benchmark data to turn that size into realistic ranges for effort, cost, and schedule.
ISBSG gives a good example of what that looks like in practice. For a retail mobile app MVP estimated at 800 to 1,200 function points, built in Java with Agile, ISBSG benchmark data from 512 comparable projects shows a median Project Delivery Rate of 7.9 hours per function point. Applied to that size range, the result is an effort estimate of 5,440 to 11,280 hours. Over a six-month delivery window, that works out to roughly 5.7 to 11.8 FTE.
That is the workflow in plain terms: size the system, check the benchmark, and build the estimate based on how similar projects actually performed.
QSM approaches the same problem from a slightly different angle with its SLIM Suite. Instead of starting with the benchmark, it uses historical performance data to stress-test an estimate after it has been built. The software shows how far a proposed estimate sits from benchmark norms, which helps teams see whether their staffing, schedule, or cost assumptions are in a reasonable range or drifting into risky territory. QSM also makes an important point: software size has to be part of the benchmark. Without size, the comparison loses meaning quickly.
Taken together, these examples show how software teams can move from measurable scope to benchmark-backed planning with a lot less guesswork. They also show how AI and machine learning can identify patterns in historical project data and support predictive insights that help project managers anticipate issues earlier.
Construction Project Benchmarking with Firm and Market Benchmarks
In construction, benchmarking often acts as a quality-control step right before a bid goes out. Teams build estimates using parametric or detailed methods, then compare those numbers with historical benchmarks to catch pricing mistakes, weak assumptions, or values that simply do not line up with past performance.
SMA Estimating explains how parametric estimating supports this during design development. Estimators use metrics such as cost per square foot, labor hours per unit, equipment utilization, and material quantities per functional unit. At that phase, the method typically lands within plus or minus 15 to 25 percent, which makes it useful for early validation while detailed takeoffs are still being developed.
Bluebeam describes a later checkpoint that many firms rely on before submission. The current estimate is compared with internal historical data such as cost per square foot, unit counts, and productivity rates. That internal benchmark becomes a practical gate. If the estimate falls outside the range of what the firm has delivered before, the team has a chance to review it before it becomes a problem in the field.
This combination works well because it covers both stages of the process: broad market-based checks early on, then firm-specific validation before the bid is finalized. Tools that support estimating workflows, including cost benchmarking tools, fit naturally into this kind of review cycle because they make those comparisons easier to repeat and defend.
A major challenge in any construction project is the lack of data. Each construction project can be unique, and confidentiality concerns often limit how much firms are willing to share data. That makes data collection and normalization especially important in the construction industry, because without good data, meaningful analysis becomes much harder.
Capital Projects: Accelerating Benchmark-Informed Estimating at Scale
Capital-intensive sectors like energy, pharmaceuticals, and industrial manufacturing face a different level of estimating pressure. The projects are bigger, the cost of being wrong is higher, and traditional estimating methods can take so long that they slow down investment decisions.
McKinsey's acquisition of Strategic Estimating Systems (SES) shows how tightly integrated benchmark data can help. SES brings industry-specific benchmark data for sectors such as energy, industrial gas, pharmaceuticals, pulp and paper, renewable energy, and biofuels. Combined with McKinsey's Capital Analytics capability, that setup allows capital cost estimates to be produced more than three times faster than with traditional methods, while also improving accuracy. For organizations managing large portfolios, that is not just a productivity gain. It changes how quickly they can screen options, prioritize projects, and move forward with confidence.
InEight focuses more on the day-to-day operating side of capital construction. Its benchmarking process uses historical and as-built project data to sharpen estimates over time, applying AI and regression analysis to improve production rate reliability. It also supports variance analysis, auditing, KPI tracking, and data normalization, with visual tools that help estimators see how current numbers compare with past results. The value is in the feedback loop: every completed project improves the benchmark set used for the next one.
Across all three industries, the pattern is the same. Build the estimate with a clear method, validate it against trustworthy benchmarks, and use that comparison to make better decisions. The tools, data sources, and level of detail may differ, but the discipline holds up across the board.
Data Collection, Tools, and Systems Needed to Support the Workflow
A dependable estimating-to-benchmarking workflow does not come from process design alone. It also depends on the systems underneath it: clean data, connected tools, and software that can handle real project complexity. If that foundation is weak, even a well-designed benchmarking method will struggle to produce consistent, usable results.
Creating a Shared Source of Truth Across Estimating and Delivery Systems
One of the biggest failure points in estimating shows up when preconstruction and project delivery teams work in separate systems. Once data is split across silos, it becomes hard to trace the gap between what was estimated and what actually happened in the field. In plenty of cases, that gap never gets captured clearly enough to learn from.
Autodesk tackles this by linking estimating and delivery tools into a shared source of truth. The process starts with a review of existing preconstruction workflows to spot where handoffs break down, then brings systems into alignment so information moves consistently from estimate to execution. Just as important, the setup supports continuous improvement. Field results feed back into templates, cost libraries, and workflows so they stay current from one project to the next.
For estimators, that means less manual reconciliation and a much clearer view of how the job was priced versus how it was actually built. That visibility is the backbone of any serious benchmarking effort. It is also where integrated estimating environments, including tools like Nomitech, tend to make a practical difference by keeping cost data and project feedback closer together. Breaking down silos matters here because departments often resist sharing data, which slows the spread of best practices and limits process improvements.
Using Historical Data, As-Built Records, and Normalized KPI Data Effectively
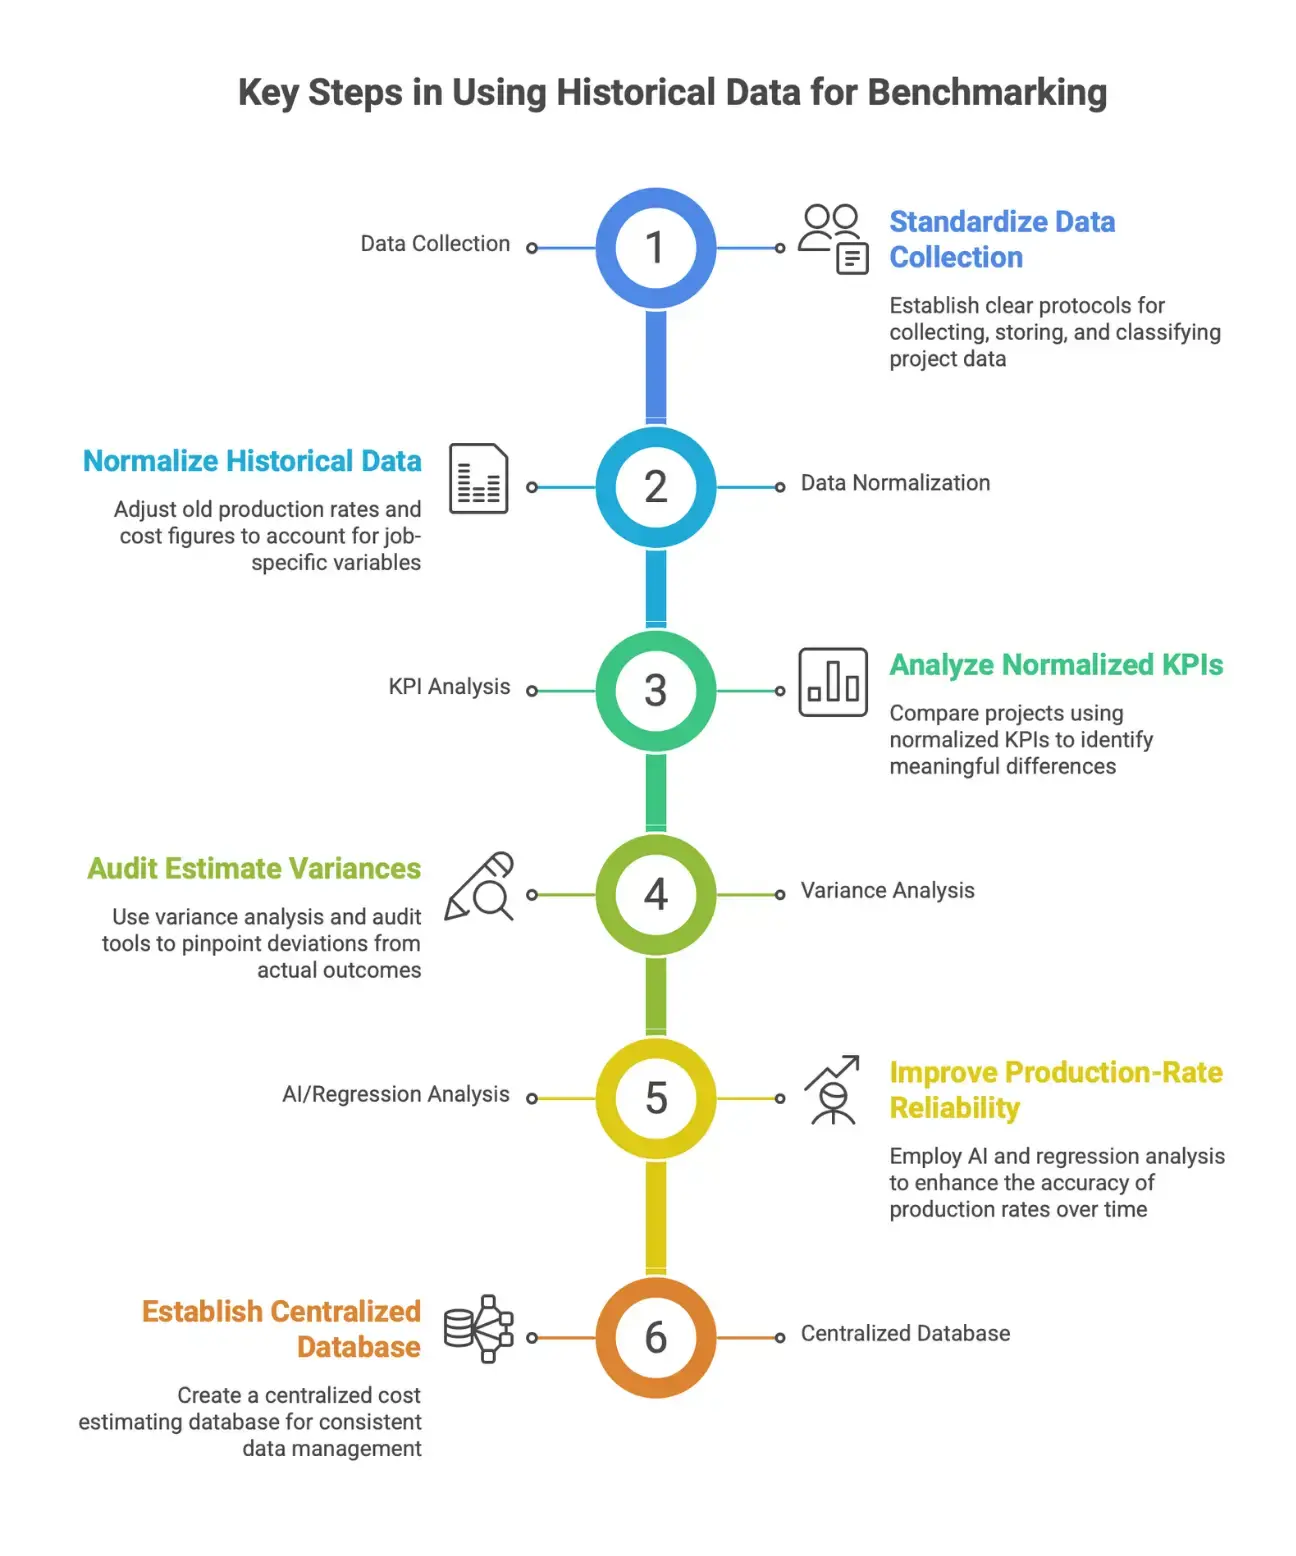
Benchmarking is only as good as the data behind it. Historical data matters, but on its own, it is rarely enough. If you do not normalize it, old production rates and cost figures carry too many job-specific variables to be reused reliably on the next estimate.
InEight describes a structured approach for capital construction that combines historical data, as-built records, and normalized KPIs to produce estimates teams can defend. Variance analysis and audit tools help pinpoint where estimates drifted from actual outcomes. AI and regression analysis are then used to improve production-rate reliability over time. When KPIs are normalized, teams can compare projects in a meaningful way even when scope, location, or site conditions differ.
This is what turns benchmarking into something more useful than a post-job review. Clean, comparable data gives estimators a stronger basis for planning future work. Instead of relying on rough allowances or memory, they can use benchmarks with much more confidence. In practice, that often depends on having a centralized cost estimating database structure that supports consistent classification, normalization, and reuse across projects.
Standardizing data collection establishes clear protocols for collecting data, storing project data, and classifying it the same way across teams. Successful benchmarking requires consistent data collection for meaningful comparisons between current estimates and past results. Without that discipline, benchmarking results may look precise but rest on the wrong data.
Leveraging Software Platforms for Real-Time Estimate Updates and Scenario Analysis
The ability to update an estimate quickly and test different cost scenarios is no longer a nice-to-have, especially on large or fast-moving projects. Spreadsheets can still play a role, but they are not built for the speed, visibility, or control most teams now need.
BuildOps shows how project cost estimating software can bring material, labor, and overhead data into one system, making it easier to run scenarios and spot cost pressure before it turns into an overrun. Real-time updates matter here. When scope changes, market prices move, or resource assumptions shift, the estimate can adjust right away instead of lagging behind the job.
For teams building a benchmarking workflow, the right software is what makes dynamic estimating workable at scale. It gives estimators a live environment where benchmark data can actually be used, tested, and refined throughout the project. That is how teams stay accurate beyond the first submission. It is also why many contractors and EPC groups are moving toward dedicated cost estimating software that support scenario planning and structured benchmark use as part of day-to-day estimating.
AI is also becoming more useful in this layer. AI enhances benchmarking by automating data collection and analysis, supporting continuous monitoring of performance metrics, and issuing real-time alerts when project metrics deviate from established baselines. That gives project managers a faster way to respond before small issues become major ones.
Governance, Best Practices, and Standardization for Repeatable Results
Getting an estimate right once takes skill. Getting reliable results across teams, project types, and business units takes discipline. Without clear controls, even strong estimators can drift into different methods, outdated cost data, or siloed workflows that make portfolio-level comparison difficult.
This is the layer that keeps the estimating-to-benchmarking workflow stable. You audit the process, put scalable standards in place, and run final checks before any number leaves your desk. In project management, that kind of governance is what helps ensure processes work across a broad range of project environments.
Auditing the Current Estimating Process to Uncover Gaps
Before you improve the workflow, you need to see where it actually breaks. That means taking a hard look at your preconstruction process and identifying where inconsistency, disconnected tools, or missing data are introducing risk.
According to Autodesk, a useful audit goes well beyond reviewing spreadsheets. It means connecting the systems your team already uses so everyone is working from the same source of truth. That is usually where hidden gaps show up, especially the ones masked by informal workarounds.
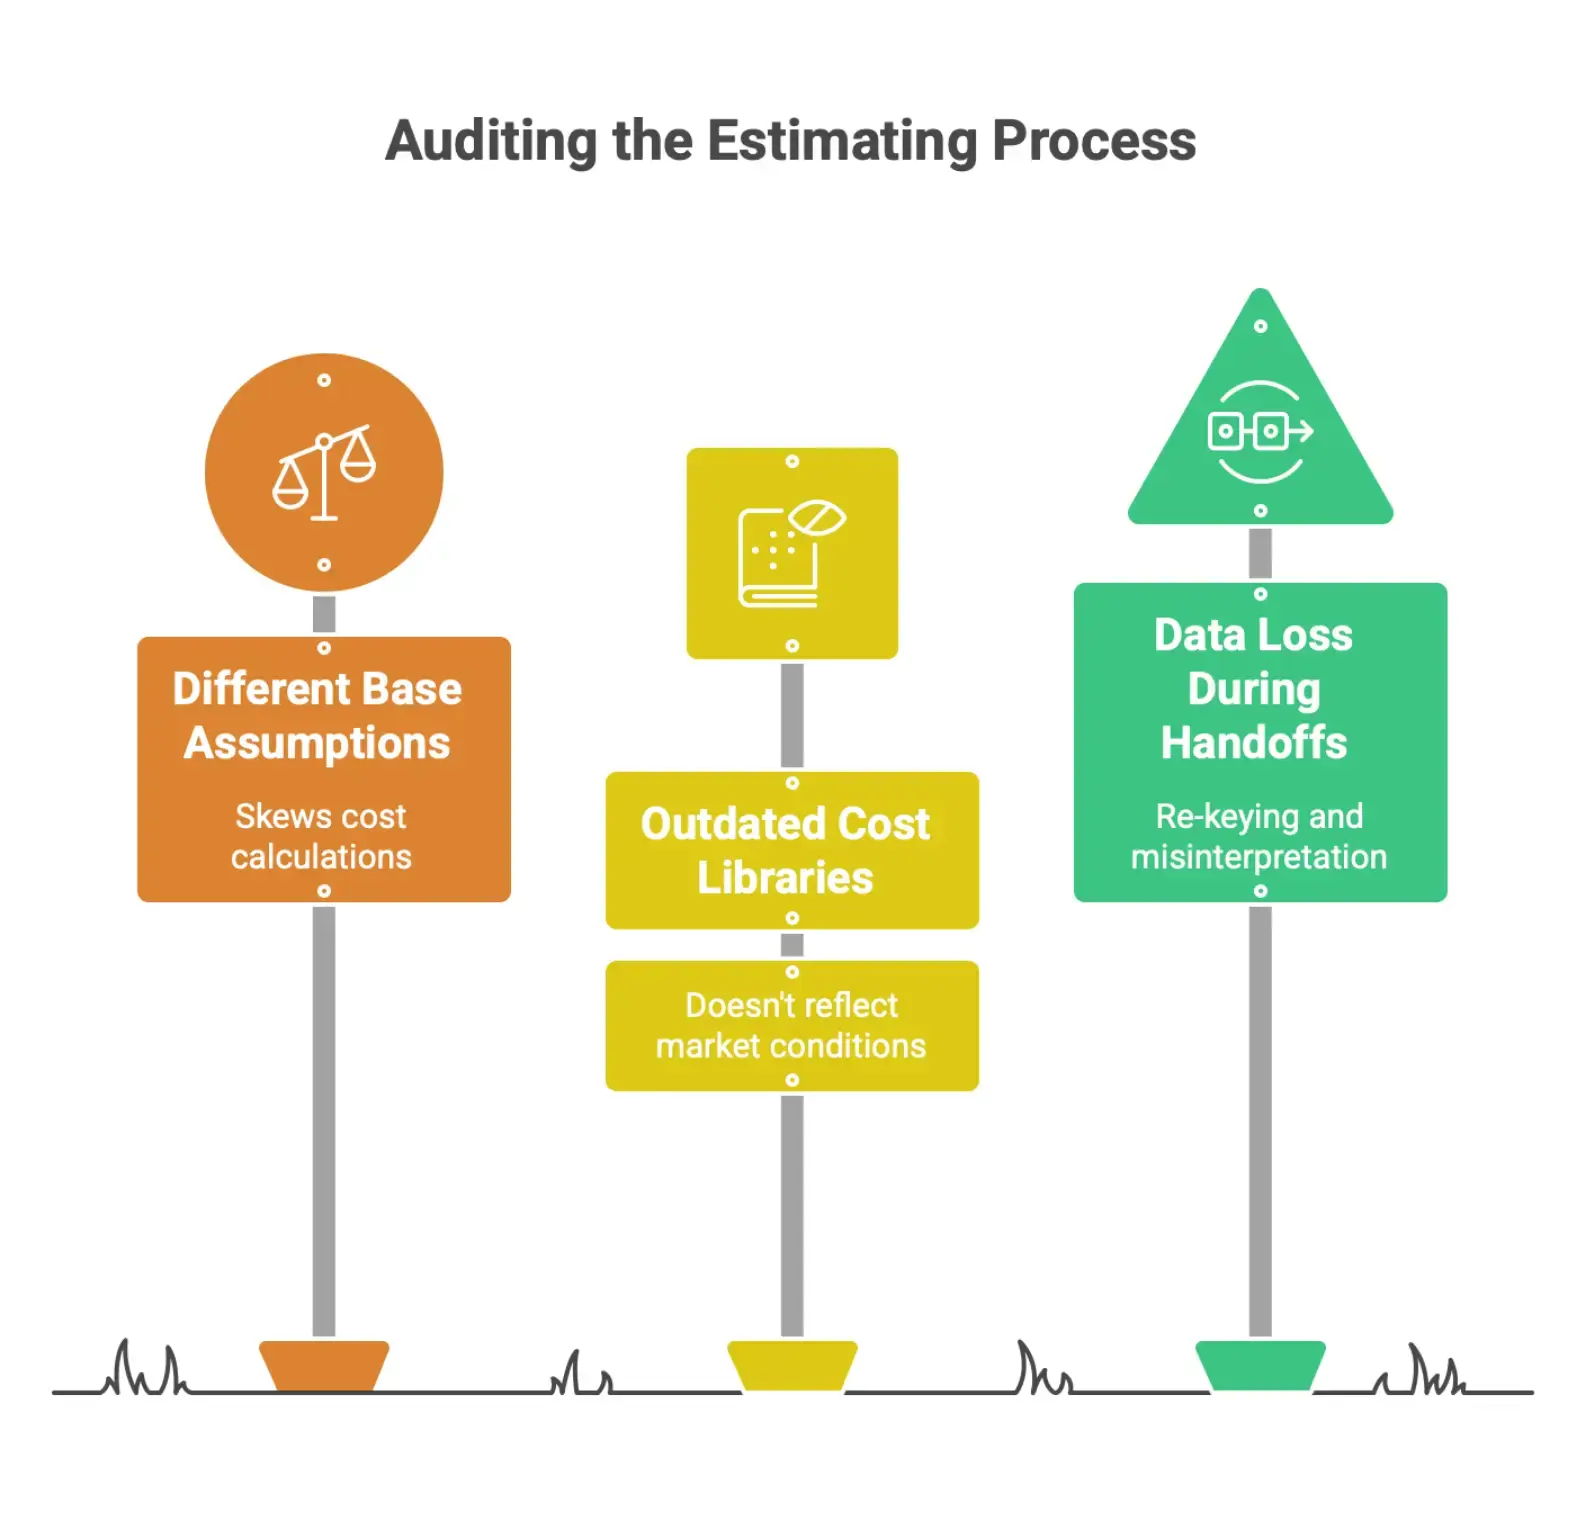
In real projects, an audit like this often uncovers issues such as:
- Estimators using different base assumptions for similar scope items
- Cost libraries that no longer reflect today's market conditions or field performance
- Handoffs between estimating and execution where data is lost, rekeyed, or interpreted differently
This should not be treated as a one-off exercise. When audits are built into the preconstruction review cycle, teams can measure the process against actual job outcomes instead of assuming the standard is still working.
For firms using structured estimating environments, including systems like Nomitech, this step is often easier because data history, assumptions, and estimate versions are already much easier to track and review.
Building Consistent Templates, Libraries, and Benchmark Rules
Once the gaps are clear, the next step is to build the shared framework that keeps everyone working from the same base. This is where templates, cost libraries, and benchmark rules stop being nice-to-have tools and start acting like real governance controls.
Autodesk highlights continuous improvement as the key to keeping these resources useful. In practice, that means you do not build a library once and leave it alone. You review feedback from completed projects, feed field results back into the system, and update templates and benchmark logic as your project data grows.
That structure pays off quickly for teams managing multiple projects or business units:
- Estimators spend less time rebuilding core estimate structures from scratch
- Project managers and reviewers get a dependable baseline for comparison
- Benchmark rules tied to historical performance make scope gaps easier to spot early
The point is not to force every estimate into the exact same shape. It is to give the team a consistent starting point, so their time goes into project-specific judgment instead of repetitive setup work.
This is also where estimate software matters. If your templates, libraries, and benchmark rules live in disconnected files, standardization rarely sticks. When they are maintained in a centralized system, updates are easier to control and teams are more likely to use the latest version. Strong best practices in this area depend on transparency, shared ownership, and clear rules for how benchmarking data is updated.
Embedding Final Quality-Control Checks Before Bids or Approvals
Even with good templates and updated libraries, every estimate still needs a formal review before it is submitted or approved. This is where benchmarking becomes more than a reference. It becomes a quality-control tool.
Bluebeam describes a validation workflow that compares the current estimate against historical company data, including cost per square foot, unit counts, and productivity rates. Done before bidding, this gives estimators and reviewers a practical way to spot numbers that sit outside the expected range.
That final check serves a simple purpose. It turns project history into an active filter. Instead of relying only on individual judgment, the team can test whether the estimate aligns with comparable work and, if it does not, confirm there is a valid reason.
A solid quality-control gate usually looks at:
- Cost totals against historical benchmarks for similar project types
- Unit rates or productivity assumptions that fall outside company norms
- Scope items that appear in benchmark data but are missing from the current estimate
Catching these issues before a bid goes out is far cheaper than fixing them after contract award. That is why the review needs to be built into the workflow, not left to chance. When it becomes part of the process every time, teams get more reliable results at scale.
In practice, this is where integrated estimating and benchmarking tools can make a real difference. If reviewers can compare live estimate data against past jobs in one place, the check is faster, clearer, and much harder to skip. Teams can also track performance metrics such as actual cost, schedule variance, or cost performance index after award to see whether the approved estimate truly held up.
Common Benchmarking Challenges and How to Avoid Them
Even a well-run estimating process can produce shaky results if the benchmarking behind it is off. Usually, the problem is not dramatic. It shows up in small gaps in how data is compared, maintained, and used. These are the mistakes teams make most often, along with practical ways to avoid them.
Comparing Projects Without Normalizing for Size, Scope, or Context
A common benchmarking mistake is comparing projects that are not truly alike. Two jobs may look similar at first glance, but differences in size, complexity, location, delivery model, or scope can make a direct comparison useless, or worse, misleading.
QSM tackles this head-on in its SLIM Suite workflow by treating software size as a required input for performance benchmarking. Without that context, deviation analysis is based on an incomplete view. The same principle applies in construction, manufacturing, energy, and other project-driven industries. If you measure cost or schedule performance without adjusting for the scale of the work, the benchmark will not reflect real conditions.
InEight follows a similar path in capital construction, combining KPI tracking with data normalization so historical comparisons are valid before they shape future estimates.
The fix is simple in concept, even if it takes discipline to do well: define what makes projects comparable, then normalize against those variables every time. Make that a standard step in the workflow, not something left to individual judgment. In practice, teams using structured estimating systems such as Nomitech often build these comparison rules directly into their estimate setup and review process, which makes consistency much easier to maintain. This is one of the most common benchmarking challenges across different industries.
Relying on Static Benchmarks Instead of Updating with Field Performance
A benchmark is only useful if it reflects current reality. Teams sometimes build a solid benchmarking database, then let it sit for months or years. That is a problem. Field productivity changes. Crew performance shifts. Material costs move. Execution strategies evolve. Static benchmarks cannot keep up.
Autodesk points to continuous improvement as a core part of standardized estimating. Their approach includes regular feedback reviews that update templates, libraries, and processes using actual field performance, not just planned assumptions. That feedback loop is what keeps benchmarks relevant.
InEight reinforces the same idea by applying AI and regression analysis to improve production rate reliability, using as-built data to refine future estimates instead of relying on stale historical averages.
The message for estimating leaders is clear: treat your benchmark database like a living system. Set review cycles. Assign ownership. Pull in field performance data from the systems where execution is actually tracked. If your estimating software can connect cost data, production rates, and historical outcomes in one place, updates become much more manageable and far less dependent on manual cleanup.
Using a Single Estimating Technique When Multiple Views Are Needed
Relying on one estimating method creates blind spots. A top-down estimate based on similar past projects can miss the detail hidden inside specific work packages. A bottom-up estimate may be highly detailed but still lose sight of how comparable projects performed overall. Either one on its own can leave gaps.
Atlassian recommends using multiple techniques together, especially analogous estimating based on historical project data and bottom-up estimating built from individual work packages. Just as important, they stress documenting the assumptions behind each method so teams can adjust with clarity when scope, risk, or execution conditions change.
That combination gives you a built-in check. When top-down and bottom-up estimates land in the same range, confidence goes up. When they do not, that difference is worth digging into before the job starts. It is often the first sign that scope is unclear, productivity assumptions are off, or key costs are missing.
A practical workflow runs these methods in parallel and captures assumptions at every level. That structure makes benchmarking more reliable and makes future estimate reviews much easier. If a number shifts later, you can see why. That is one reason many mature estimating teams use systems like Nomitech alongside historical databases and field feedback loops, so they can compare multiple estimating views without losing traceability.
Project Management Benchmarking Types and Best Practices
Benchmarking in project management is broader than a single comparison against one outside source. The strongest programs use several types of benchmarking, each with a different purpose and value.
The four main types of benchmarking in project management are internal benchmarking, competitive benchmarking, functional benchmarking, and generic process benchmarking. Internal benchmarking compares results across teams, business units, or past projects inside one organization. Competitive benchmarking compares outcomes against direct competitors or industry peers. Functional benchmarking looks at organizations outside your sector that excel at a specific capability. Generic process benchmarking focuses on core workflows such as decision making, change control, or resource planning that appear in almost every business.
Internal benchmarking is often the easiest place to begin because the data is easier to access and the lessons are closely related to how your own project teams work. Competitive benchmarking is valuable when you need to understand market position, cost competitiveness, or delivery gaps that affect bids and growth. Functional benchmarking can bring in fresh ideas from different industries, while generic process benchmarking helps teams improve universal project management practices.
Choosing the right approach depends on the question you are trying to answer. If the issue is whether a bid is high for your own portfolio, internal benchmarking may be enough. If the issue is whether your estimate is realistic in the market, competitive benchmarking or external benchmarking may be more useful. In all cases, best practices start with the right metrics, good data, and clear business goals.
How Decision-Makers Can Implement the Workflow
Putting an estimating-to-benchmarking workflow in place does not happen overnight. For executives and operations leaders, though, it also does not need to feel like a massive overhaul. The best results usually come from clear structure, reliable data, and tools that can scale as the organization grows. Here is a practical way to move from plan to execution.
Begin with High-Value Project Categories and Available Benchmark Data
Instead of trying to standardize everything at once, start where the stakes are highest. High-value or high-complexity project categories are usually the right place to begin because they carry the most financial exposure and often come with better historical data.
That approach lines up with what leading firms are already doing. McKinsey & Company shows this in practice by bringing Strategic Estimating Systems' industry-specific benchmarks into its Capital Analytics platform across sectors like energy, pharmaceuticals, renewable energy, and industrial gas. The payoff is faster capital cost estimates, more than three times faster than traditional methods, along with stronger accuracy.
The takeaway is straightforward. Benchmark data works best when it matches the industry, asset type, and project profile in front of you. In capital-intensive environments, sector-specific benchmarks paired with a structured estimating process can improve early-phase accuracy in a meaningful way.
Practical steps to get started:
- Identify the two or three project categories where overruns happen most often or cost the most when they do
- Review the benchmark data already available to you, whether that comes from internal project history or external market sources
- Build the workflow around those categories first, then expand once the process is working
This phased approach is usually more sustainable than trying to standardize every estimate at once. Adopting incremental implementation lets organizations start with manageable exercises before scaling to broader benchmarking efforts.
Pair Benchmark Validation with Software-Enabled Scenario Planning
Once the benchmark foundation is in place, the next step is connecting it to software that lets teams test assumptions, compare scenarios, and adjust quickly when project conditions shift.
BuildOps points out how estimating software can bring material, labor, and overhead data into one working environment. When that information is tied to scenario modeling, teams can spot likely overruns earlier and update estimates as the job changes.
In capital construction, InEight goes further with benchmark-driven estimating supported by visual tools, audit trails, and variance analysis. The platform also uses AI and regression analysis to improve production rate reliability, which is often one of the hardest variables to pin down on large projects.
This is where the workflow starts to give decision-makers something genuinely useful: visibility before risk turns into cost. Scenario planning helps teams compare best-case, expected, and risk-adjusted outcomes using validated benchmark data instead of rough assumptions. Tools such as CostOS can also fit naturally at this stage, especially when teams need consistent estimate structures and clearer links between benchmark inputs and cost model outputs.
When evaluating software for this stage, look for platforms that support:
- Real-time cost updates as scope, pricing, or market conditions change
- Scenario comparison tools built around actual benchmark data
- Variance tracking against established benchmarks across the full project lifecycle
Track Outcomes and Feed Actual Performance Back into Future Projects
The last piece, and arguably the most important, is closing the loop. Producing a solid estimate has value on its own. But the organizations that keep getting better year after year are the ones that capture actual project performance and use it to improve the next estimate.
InEight supports this directly by bringing as-built data into its benchmarking workflow for capital construction. By tracking KPIs through data normalization and using historical outcomes to refine future estimates, teams create a benchmark library that keeps improving instead of one that just sits on a shelf.
Autodesk reinforces the same idea from a governance standpoint. Their approach focuses on auditing preconstruction workflows, connecting systems into a shared source of truth, and setting regular feedback reviews so field performance data flows back into estimating templates, libraries, and standards.
That feedback cycle turns benchmark data into a living asset. It also strengthens governance because leaders can show that estimates are based on real delivery performance, not just industry averages or outdated assumptions. This is also where structured estimating environments, including systems like Nomitech, can support long-term consistency by making it easier to update templates, retain project knowledge, and compare planned versus actual outcomes over time.
To build this into your workflow:
- Define the KPIs and quality metrics that will be tracked from initial estimate through project closeout
- Assign clear ownership for capturing and normalizing as-built data after each project
- Schedule routine reviews to update estimating templates and benchmarks based on actual results
- Use variance analysis to find where estimates consistently drift and investigate why
When these three steps work together, the estimating-to-benchmarking workflow becomes more than a process improvement. It becomes a strategic capability that gets stronger with every project your team delivers. That kind of project benchmarking supports better project success, stronger stakeholder satisfaction, and more reliable business outcomes.
Key Takeaways
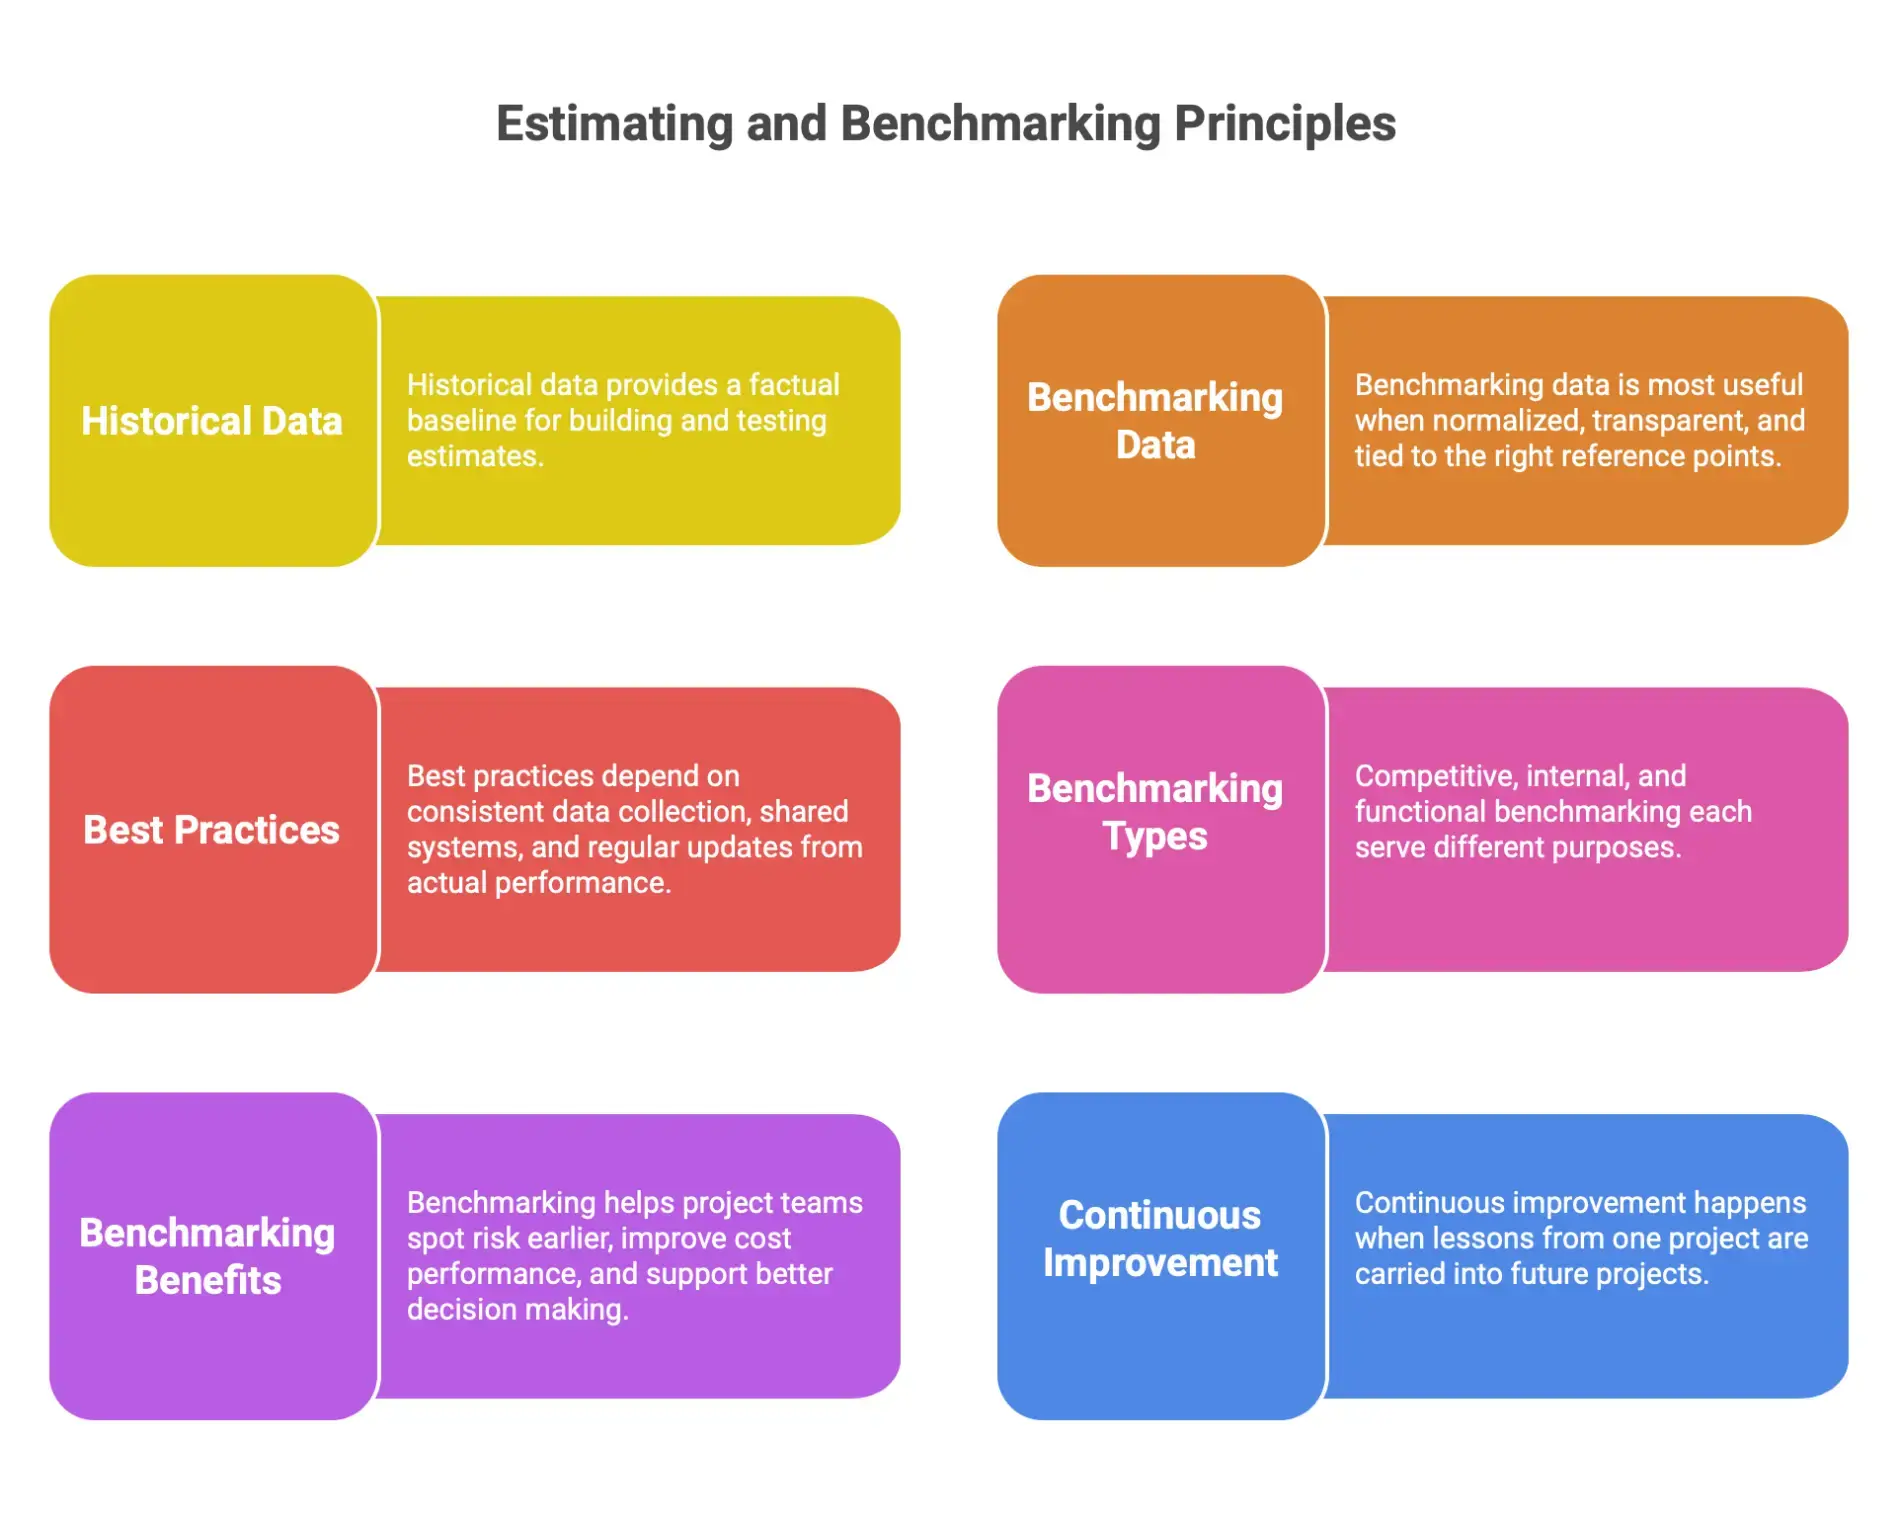
A few principles hold up across nearly every estimating and benchmarking program:
- Historical data gives teams the factual baseline needed to build and test new estimates
- Benchmarking data is most useful when it is normalized, transparent, and tied to the right reference points
- Best practices depend on consistent data collection, shared systems, and regular updates from actual performance
- Competitive benchmarking, internal benchmarking, and functional benchmarking each serve different purposes
- Benchmarking helps project teams spot risk earlier, improve cost performance, and support better decision making
- Continuous improvement happens when lessons from one project are carried into future projects
Frequently Asked Questions
What is an estimating-to-benchmarking workflow?
An estimating-to-benchmarking workflow is a structured process that starts with an initial estimate, compares it against historical or market benchmark data, then refines and validates the result before decisions are made. It turns estimating into a repeatable feedback loop instead of a one-time exercise.
Why is benchmarking important in project estimating?
Benchmarking helps teams test whether an estimate is realistic by comparing it with similar past projects or industry references. It improves confidence, flags outliers early, and gives executives and sponsors a stronger basis for budget, schedule, and resource decisions.
Which estimating methods are commonly used before benchmarking?
Teams often use a mix of analogous estimating, bottom-up estimating, parametric estimating, and in software, functional size and rate-based estimating. Using multiple methods helps expose gaps and makes benchmark checks more meaningful.
What data is needed to support benchmarking?
Useful benchmarking depends on historical project data, as-built performance records, and normalized KPI data that can be compared consistently across projects. A shared source of truth and a centralized estimating database make that data much easier to reuse.
How do software platforms support estimating-to-benchmarking workflows?
Software platforms help standardize inputs, manage estimate versions, run scenario analysis, and compare live estimates against benchmark data. Tools such as CostOS can also help teams keep estimate assumptions, benchmark checks, and updates connected in one workflow.
Conclusion
An estimating-to-benchmarking workflow gives teams a more reliable way to plan, validate, and improve project estimates over time. Instead of relying on isolated estimates and informal reviews, organizations can create a structured process that starts with clear scope and sizing, applies the right estimating methods, checks those numbers against real benchmark data, and feeds actual performance back into future work.
That discipline matters because better estimates do more than improve forecasting. They strengthen governance, reduce avoidable risk, and give decision-makers more confidence when budgets, bids, and investment choices are on the line. Whether the work is in software, construction, or capital projects, the principle is the same. The stronger the link between estimating and benchmarking, the stronger the decisions built on top of it.
Ready to Take the Next Step?
If you’re exploring modern cost estimation platforms, check out Nomitech’s full suite or get in touch with our team to find the right fit for your workflows.





Stay Up to Date
Subscribe to our Newsletter today and receive the latest updates, trends, expert insights, and exclusive offers tailored to your specific industry.