

What Is Cost Optimization Benchmarking?
TL;DR: Cost optimization benchmarking compares costs against credible internal and external reference points to identify performance gaps, improve value and support better decisions. In construction and engineering, it is most useful when cost data is normalized for scope, location, specification, risk and delivery model.
Cost optimization benchmarking helps organizations understand whether their costs are justified, competitive and aligned with the value being delivered. It is not about treating every high cost as a problem. It is about comparing spend against relevant benchmarks, understanding why differences exist and deciding where improvement is worth pursuing.
In construction and engineering, where every project has its own mix of scope, site conditions, specifications, risk and delivery constraints, the discipline is especially valuable. It helps estimators, cost engineers, quantity surveyors and project controls teams separate genuine inefficiency from legitimate cost variation.
What is cost optimization benchmarking?
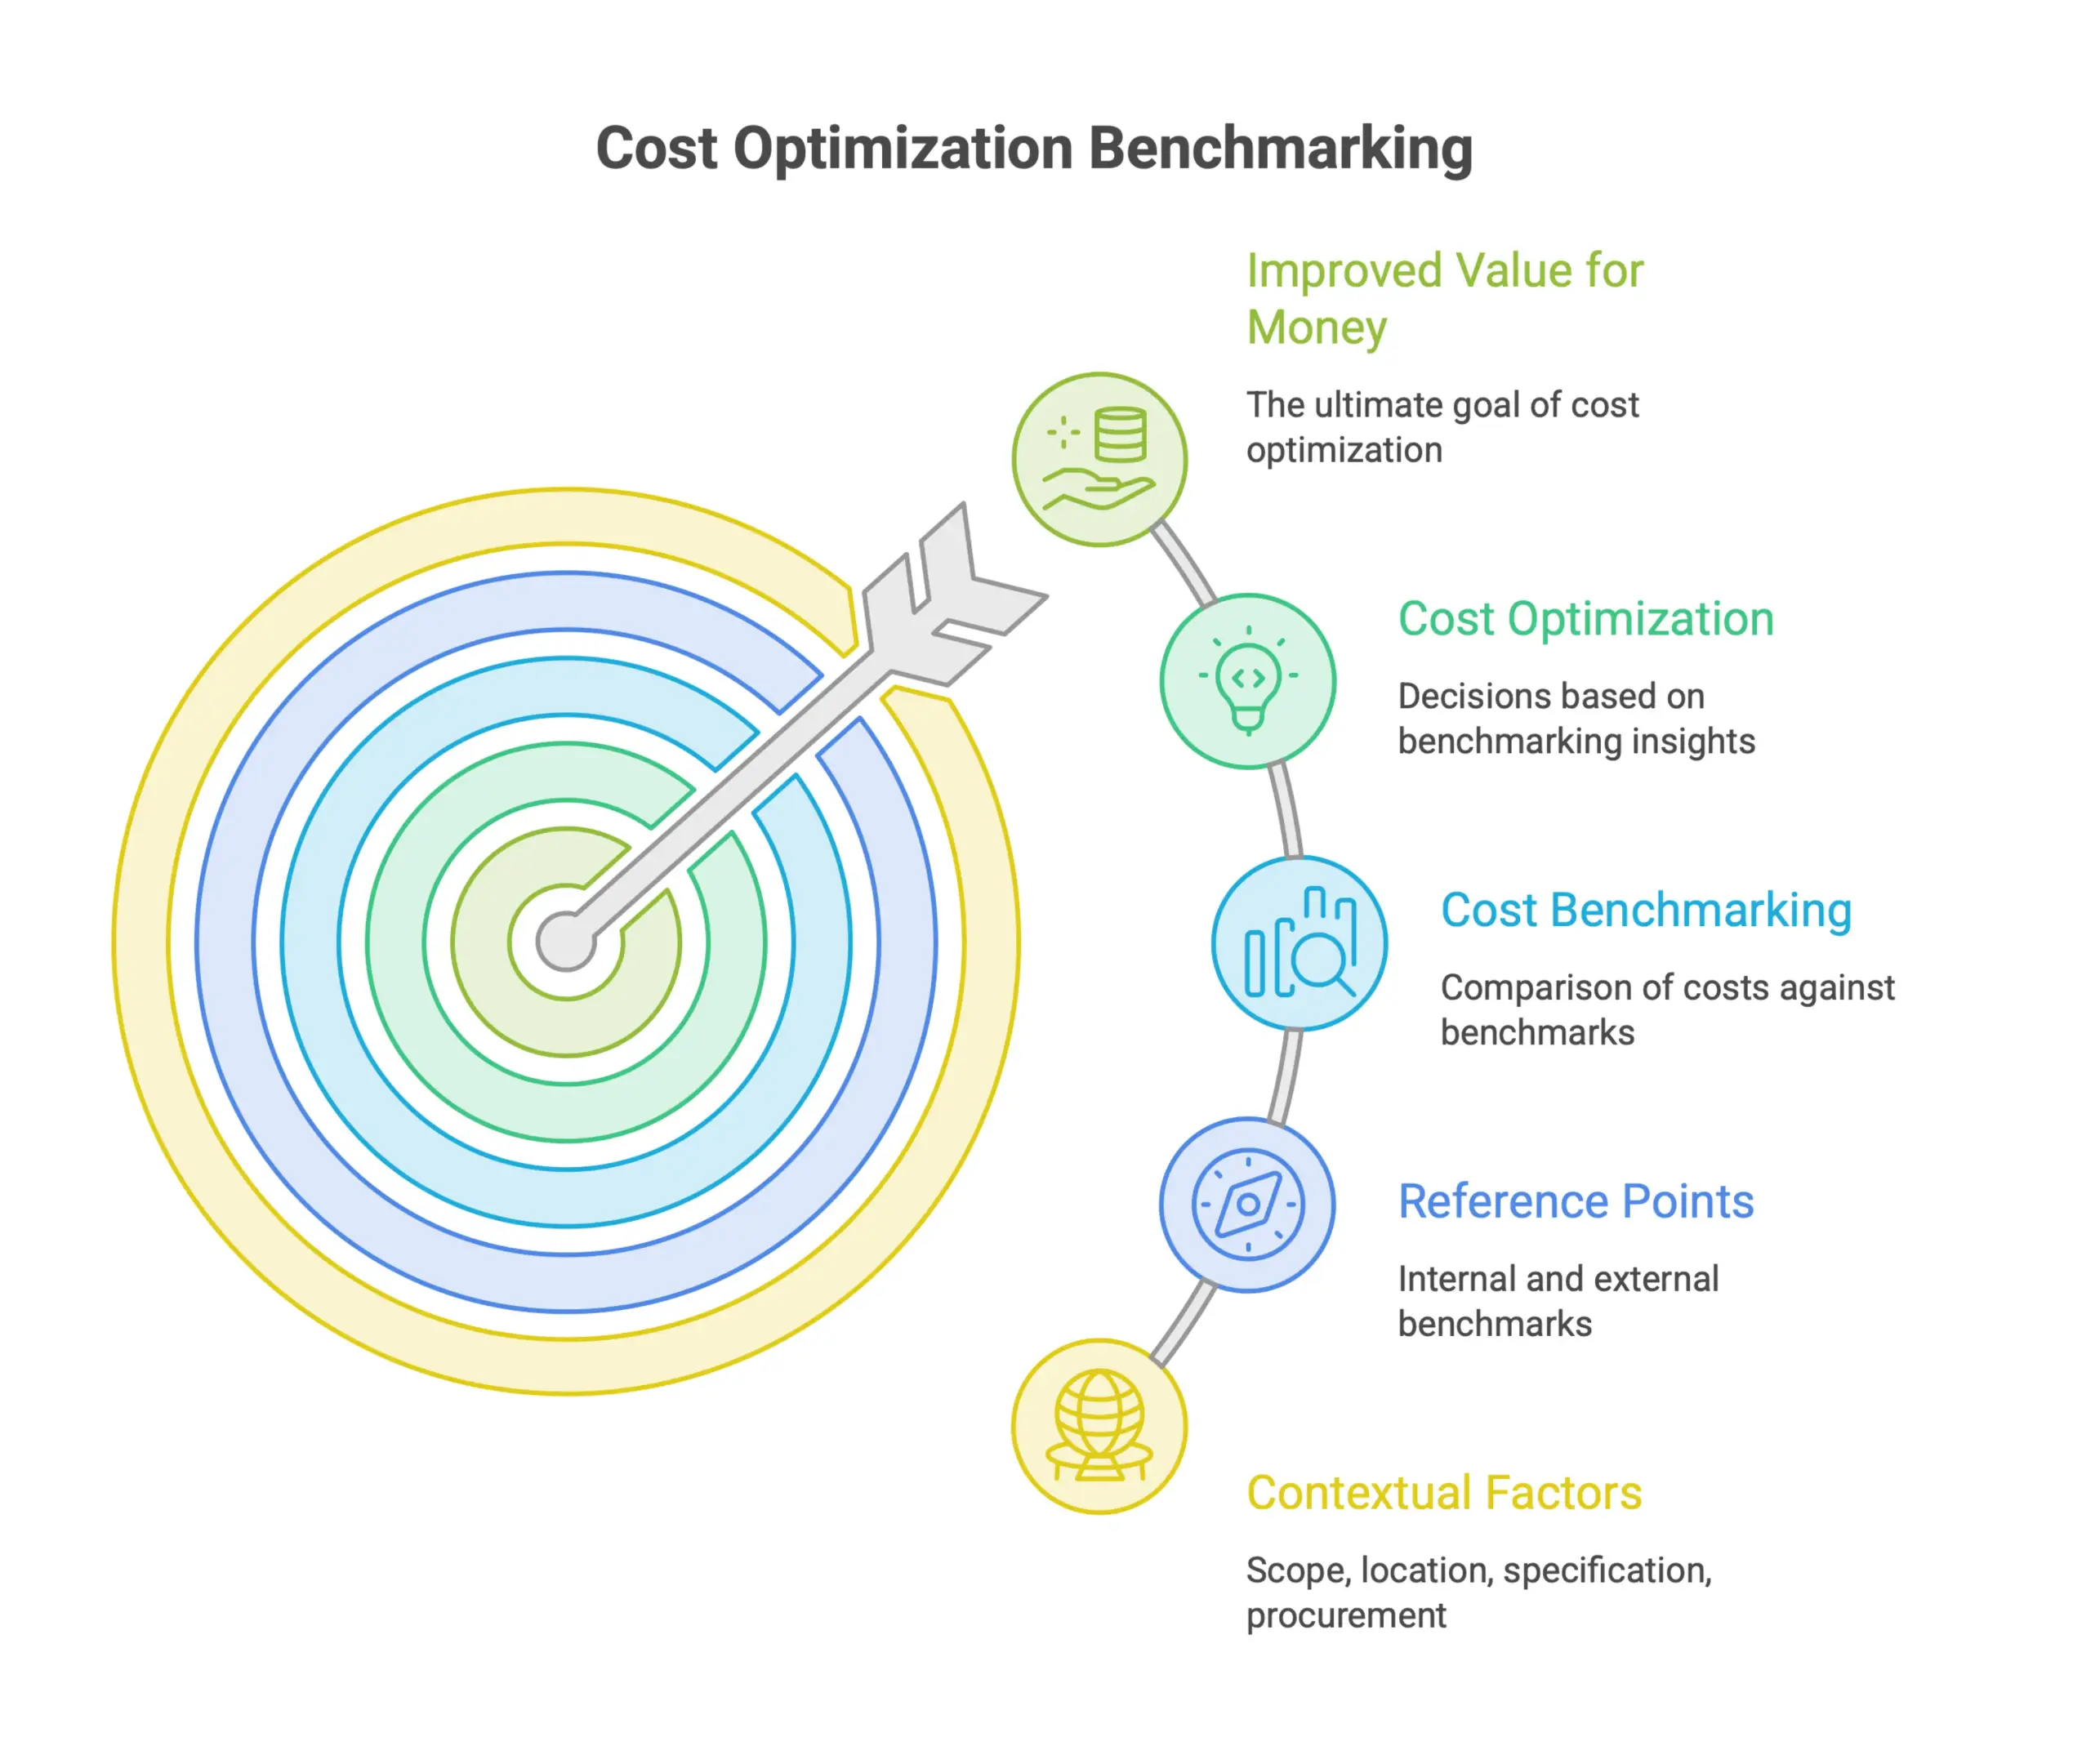
Cost optimization benchmarking is the structured comparison of costs against internal and external reference points to understand cost structures, cost drivers and performance gaps. The aim is to improve the relationship between cost, quality, risk and business value. As the RICS defines it, benchmarking means collecting and comparing data in a structured way, either within an organization or against external peers, to identify best-in-class performance and support better value for money over time.
The key distinction is that benchmarking is the comparison method, while optimization is the decision that follows. Cost reduction is narrower because it focuses on spending less. Cost optimization asks whether the cost is appropriate for the outcome being delivered. A higher cost may be justified by complexity, quality requirements, risk allocation or schedule pressure. A lower cost may look attractive but carry hidden exposure.
In construction and engineering, this distinction matters. Comparing cost per square metre, unit rates, labor productivity, equipment costs, preliminaries or indirect costs can highlight unusual patterns. For more context on the underlying comparison discipline, see this overview of cost benchmarking explained. But the comparison only holds up if scope, location, specification and procurement route are considered. Without that context, the numbers can tell the wrong story.
Used well, cost optimization benchmarking gives estimating and project controls teams a stronger basis for budgets, helps organizations understand where they sit against the market and supports targeted action instead of blunt cuts.
Why cost optimization benchmarking matters
Without a credible reference point, it is difficult to know whether a cost is fair, inflated or competitive. Benchmarking gives teams that reference point by comparing actual or estimated costs against internal records, historical project data or industry benchmarks.
The first benefit is visibility. Benchmarking turns scattered cost data into actionable insights by showing where spend sits against similar projects, processes or delivery models. It can expose overspend, help teams identify inefficiencies, identify areas with potential cost savings, and reveal savings opportunities before they become locked into budgets, contracts or overhead structures. In construction and engineering, that might mean seeing that labor productivity on a certain project type is consistently below benchmark, or that indirect costs are rising faster than comparable jobs.
That visibility improves decisions throughout the project lifecycle, supporting more informed decisions through a data driven approach. Estimators can refine unit rates and cost models against trusted reference data. Capital planning teams can set budgets that are ambitious but realistic. Procurement teams can test whether supplier and subcontractor pricing reflects current market conditions. Project controls teams can spot cost drift earlier by comparing actual performance against expected patterns. Teams should also understand the difference between cost benchmarking and cost estimating, because benchmarking tests costs against reference data while estimating forecasts the likely cost of a specific project.
It also helps teams avoid judging cost efficiency in isolation. As Springer's work on cost performance and benchmarking in construction projects makes clear, strong cost performance means staying within budget without sacrificing quality. A benchmark result should be read alongside schedule, risk, scope and service levels. The point is to improve the balance between cost and value to support business performance.
The cost optimization benchmarking process
A structured process turns cost data into useful decision support. Without it, benchmarking can become a set of interesting comparisons that do not lead to action.
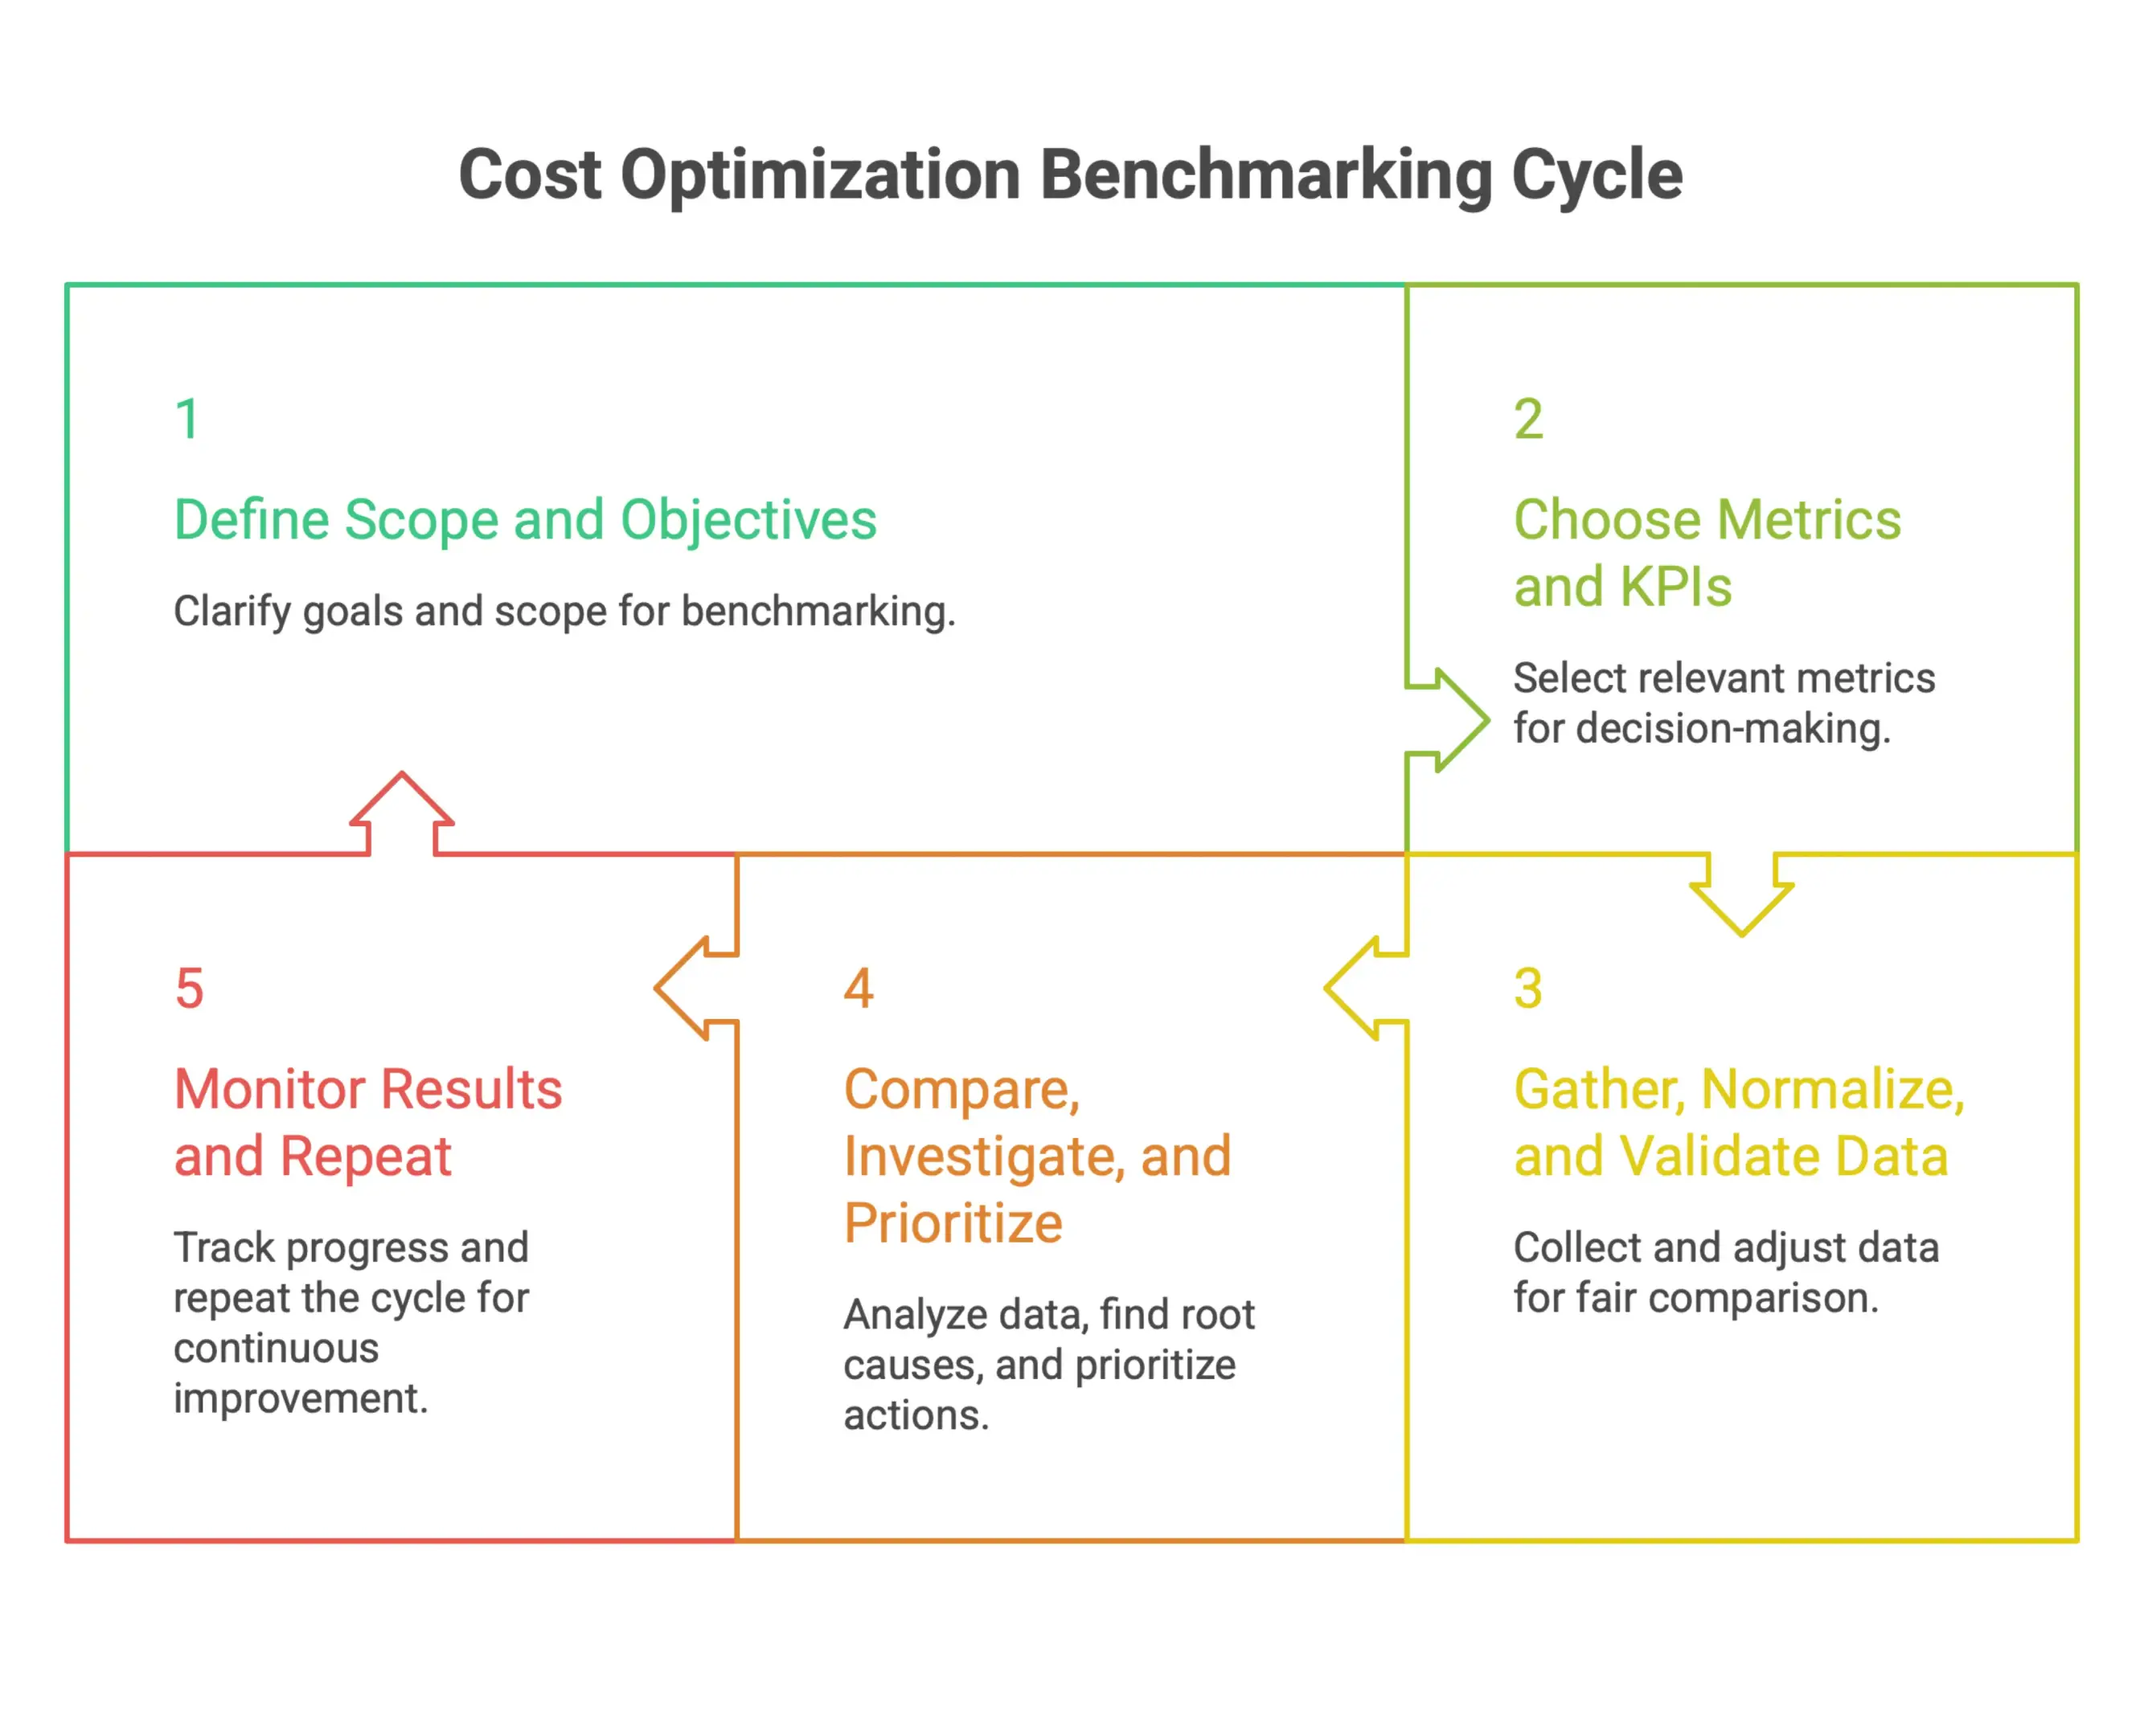
1. Define scope and objectives
Start by deciding what the benchmarking exercise needs to answer and how those objectives align with strategic goals. Are you testing an early-stage budget? Comparing cost efficiency across project types? Trying to understand why indirect costs are higher than expected? Looking for procurement savings?
Clear objectives shape the data you collect, the benchmarks you choose, the metrics you use and the level of detail required. A benchmark used for strategic capital planning to support maximizing business value will not need the same granularity as one used to challenge a live project estimate or investigate package-level productivity to improve operational efficiency.
2. Choose the right metrics and key performance indicators
The metrics should match the decision being made. Total cost has its place, but on its own it rarely explains much. A strong baseline should include total ownership costs across all departments and non-value-added activities. More useful measures include unit cost, cost per output, labor costs, raw materials, and material cost ratios, productivity rates, contingency levels, subcontractor cost shares and indirect cost percentages, with good metric selection also distinguishing fixed costs from variable costs.
In project delivery settings, these metrics become more reliable when tied to a consistent work breakdown structure or cost breakdown structure. That gives teams a stable basis for comparison and avoids vague benchmarking, where numbers appear similar at the top level but are built from different scopes underneath.
3. Gather, normalize and validate benchmark data
Collecting data is only the beginning. Raw cost figures from different projects, regions or organizations are rarely comparable without adjustment. Location, project scale, specification, procurement route, delivery model and time period all need to be considered before the numbers can support a fair comparison. Where relevant, normalization can also account for revenue, number of customers, and geographic costs.
The UK Infrastructure and Projects Authority recommends this kind of structured approach for major capital projects. Normalization and assumptions that support cost transparency are what make benchmarking defensible. If a benchmark cannot explain what has been adjusted, excluded or assumed, it will struggle under scrutiny.
Validation matters too. Cost data should be checked for completeness, consistent coding and clear scope boundaries to improve visibility into the organization's spending. Otherwise, the analysis may reflect messy data rather than real performance.
4. Compare, investigate root causes and prioritize action
Once the data has been normalized, use benchmarking analysis to compare your cost position against the chosen benchmarks and examine the gaps. But do not stop at the variance. A cost that is 12 percent above benchmark is not automatically a problem, and a cost below benchmark is not automatically good news.
The next step is to understand the reason behind the difference. It may come from procurement strategy, design choices, labor productivity, site constraints, scope definition, risk allocation, change management or delivery method. This is where benchmarking becomes practical because it helps teams reduce costs by pointing them toward effective strategies rather than vague instructions to spend less.
Prioritization is important. Not every gap is worth chasing. Focus on areas with material cost impact, realistic improvement potential, opportunities for meaningful savings rather than simple cutting costs, and limited risk to quality, safety, schedule or service performance.
5. Monitor results and repeat the cycle
Benchmarking is most valuable when it becomes part of normal cost management, not a one-off review. After improvement actions are introduced, track progress. Update the baseline as new project data becomes available, since repeated benchmarking supports continuous improvement and requires continuous discipline.
Built into budgeting, estimating reviews, procurement decisions, project controls reporting and management reviews, benchmarking helps teams improve cost performance and improving productivity over time before overruns force the issue. It also builds a better historical cost base over time, helping teams redirect savings toward higher-value priorities.
Benchmarking metrics and data foundations
Benchmarking is only as reliable as the data behind it. Before comparing costs against any internal or external reference point, teams need to know what they are measuring, how the figures are structured and whether the data is consistent enough to support decisions. This guide to benchmarking data explains how different data types and examples can support more reliable performance measurement and comparison.
The most useful metrics cover both cost and performance. On the cost side, that includes total project cost, unit cost, cost per output, labor cost, material cost, equipment cost, subcontractor cost, contingency and indirect costs. On the performance side, productivity rates, cycle time, supply chain performance, quality outcomes, risk exposure and service levels add necessary context. Reducing cycle time can lower supply chain costs by over 72%, which makes inventory management and working capital relevant benchmarking considerations.
A single metric can mislead. A project may look cheap at total cost level but carry an underfunded contingency. Another may look expensive until location, specification or risk allocation is considered. Benchmarking works best when several measures are read together to assess cost, performance and operational efficiency.
For construction and engineering teams, structured project data is essential. Historical costs should be organized by work breakdown structure or cost breakdown structure, with consistent cost codes across projects. Quantity takeoff data gives the volume basis for unit rates. Cost models connect scope, specification and cost. Estimate classifications show how mature the number is, from early concept estimate through to control budget. Project controls data then shows how actual costs perform against those baselines over time. For teams working with benchmarking, historical cost data, normalization, cost modelling and benchmark databases, CosMO is the most relevant Nomitech product to explore.
Historical costs need to be adjusted for location, time, scale and specification before they can be trusted as benchmarks. As the CNBA guidance on construction cost benchmarking notes, this means applying price indices, location factors and standardized cost codes so the comparison reflects equivalent scope, not just similar-looking jobs.
Poor data structure is one of the most common reasons benchmarking fails. If cost codes vary from project to project, indirect costs are buried inside line items or quantities are captured inconsistently, the resulting benchmark will reflect data problems rather than real cost drivers.
Turning benchmark findings into action
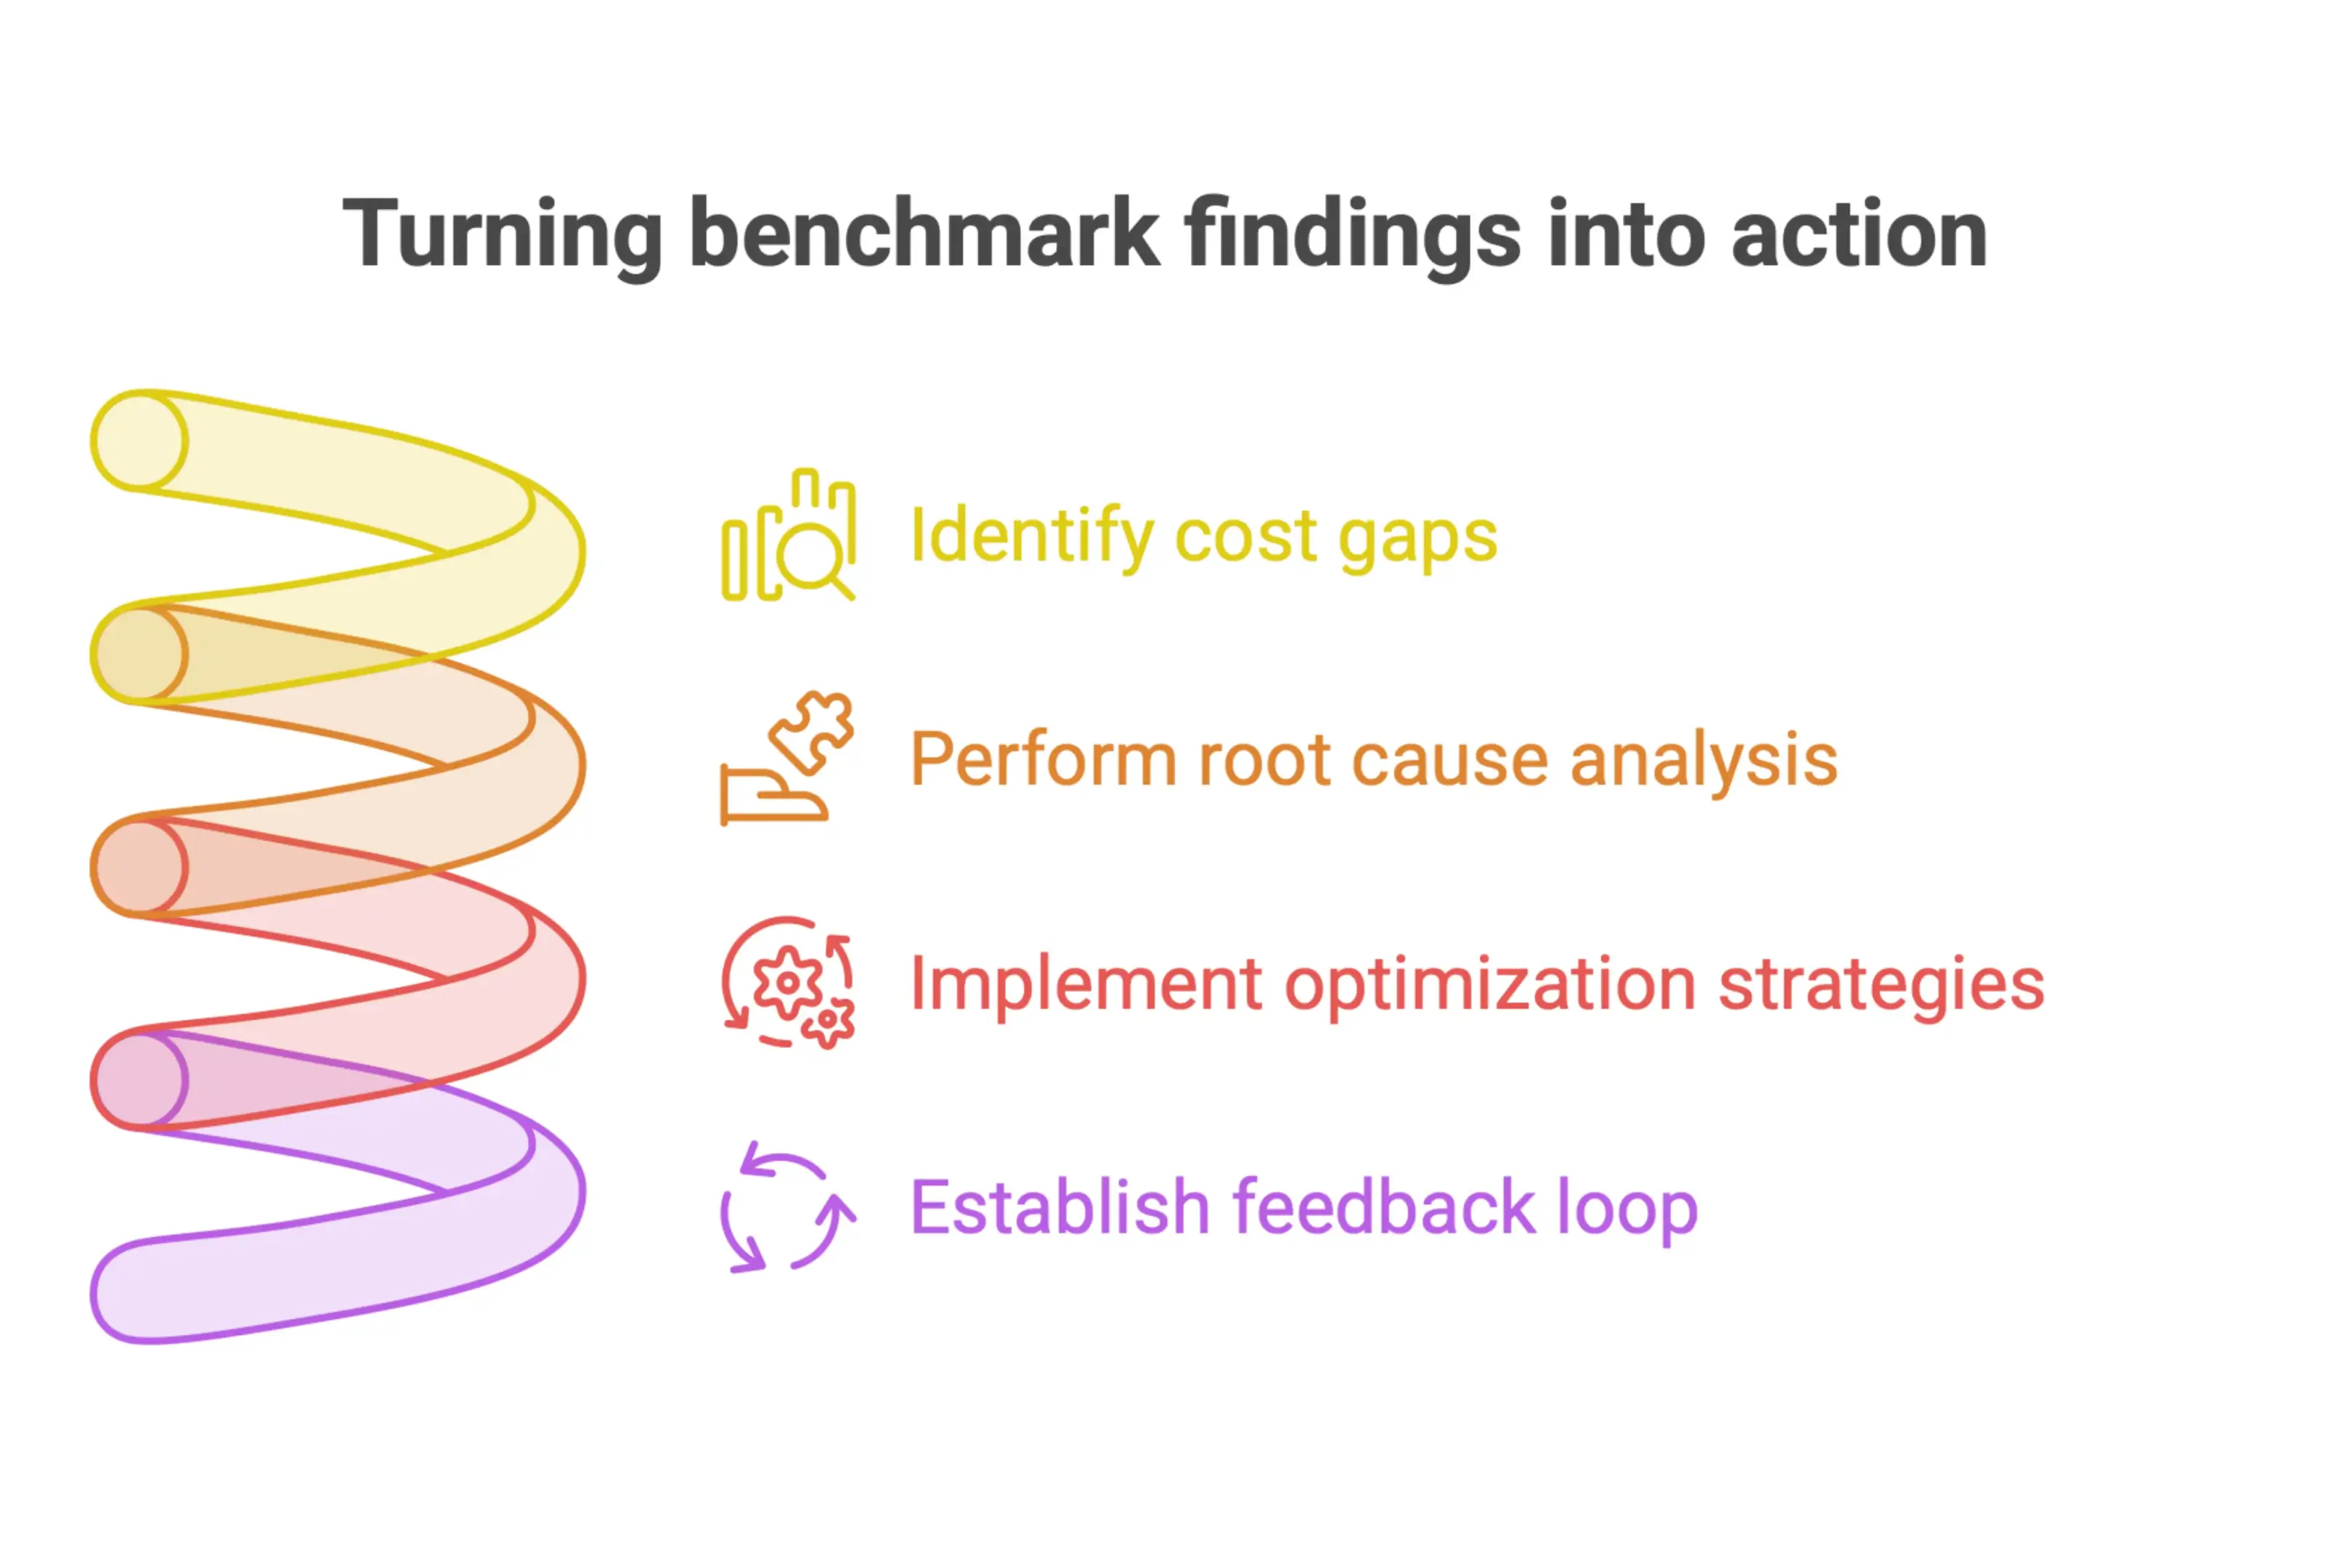
Finding a cost gap is only the start. The real value comes from turning the finding into focused action aimed at optimizing costs without damaging quality, scope or performance.
The right response depends on where the gap appears. In construction and engineering, common cost optimization strategies include reviewing procurement strategies and supplier contracts, applying design-to-cost thinking, standardizing components or delivery methods, improving planning and sequencing, tightening cost control governance, and using automation and workflow redesign aimed at enabling organizations to reduce unnecessary administrative effort. Systematic approaches can deliver significant savings, with some organizations achieving 60-80% cost reductions. Where administrative or reporting effort is too high, automation may reduce overhead without affecting output quality. Where estimating has been unreliable, better cost coding, stronger unit rate libraries and cleaner historical data can improve forecast accuracy.
Treat each finding as a question before treating it as a fix. Benchmark data shows where a difference exists. Root cause analysis explains why. Skip that step and the organization may cut the wrong thing. A line item that looks high against a benchmark may reflect different scope, a higher specification, a tougher location or risk that the comparison has not captured.
The organizations that improve cost performance consistently use benchmarking as an ongoing management discipline. As the Infrastructure and Construction Advisory Council recommends, benchmarks should be reviewed regularly to sharpen forecasting and support cost control over time.
Done properly, cost optimization benchmarking creates a feedback loop. Projects generate data. That data improves benchmarks. Better benchmarks help improve performance in estimates, budgets and controls, and can produce cost savings over time. Over time, the organization becomes more confident about what things should cost and quicker to spot when performance is drifting.
Frequently Asked Questions
How is cost optimization benchmarking different from cost cutting?
Cost cutting focuses mainly on reducing spend. Cost optimization benchmarking asks whether costs are appropriate for the value, scope, risk and performance being delivered. It helps teams identify where savings are justified and where higher costs may be reasonable.
What data is needed for cost optimization benchmarking?
Useful benchmarking depends on structured cost data, consistent cost codes, quantities, unit rates, project scope, location, time period, specification, delivery model, and, in modern operating baselines, cloud spending. For construction projects, historical costs linked to a work breakdown structure or cost breakdown structure make comparisons more reliable.
How often should cost benchmarks be updated?
Benchmarks should be reviewed regularly, especially when market prices, labor conditions, procurement strategies or project delivery models change. In project-based environments, update benchmark data after completed projects and revisit it during estimating, budgeting and project controls reviews.
Ready to Take the Next Step?
If you want to turn historical costs, benchmarks and project data into more confident optimization decisions, explore Nomitech’s full suite or get in touch.





Stay Up to Date
Subscribe to our Newsletter today and receive the latest updates, trends, expert insights, and exclusive offers tailored to your specific industry.