

Benchmarking Database Schema: What It Is and How It Works
TL;DR: Database schema benchmarking helps teams validate schema design before it becomes an expensive production dependency.
The right benchmark compares workload fit, schema shape, data types, operational resilience, and cost impact.
Strong results give CIOs, CTOs, data leaders, and product teams evidence for better architecture decisions.
Database Schema Benchmarking Fundamentals: Turning Schema Design Into Measurable Business Evidence
Choosing a database schema too early can box teams into slow queries, costly rework, and shaky cost models. When project data, estimates, and operational systems are scattered across tools, even strong cost estimation software is only as reliable as the database design behind it.
That pressure is only increasing. Bids are tighter. Projects span more systems. Data volumes keep growing faster than teams can manually validate. A schema that looks tidy in development can still struggle under real query patterns, concurrent writes, migration work, or analytics workloads.
Database schema benchmarking gives technical leaders a practical way to test those decisions before they become hard production dependencies. It turns schema design from a best-guess architecture discussion into measurable evidence. This section breaks down what schema benchmarking measures, why it matters to different decision-makers, and how to think about it across workload types.
What Database Schema Benchmarking Measures
Database schema benchmarking is the process of testing how a database schema performs under defined conditions, workloads, and query patterns. Instead of judging the database engine in isolation, it looks at the structural choices that determine how data is stored, indexed, joined, and retrieved.
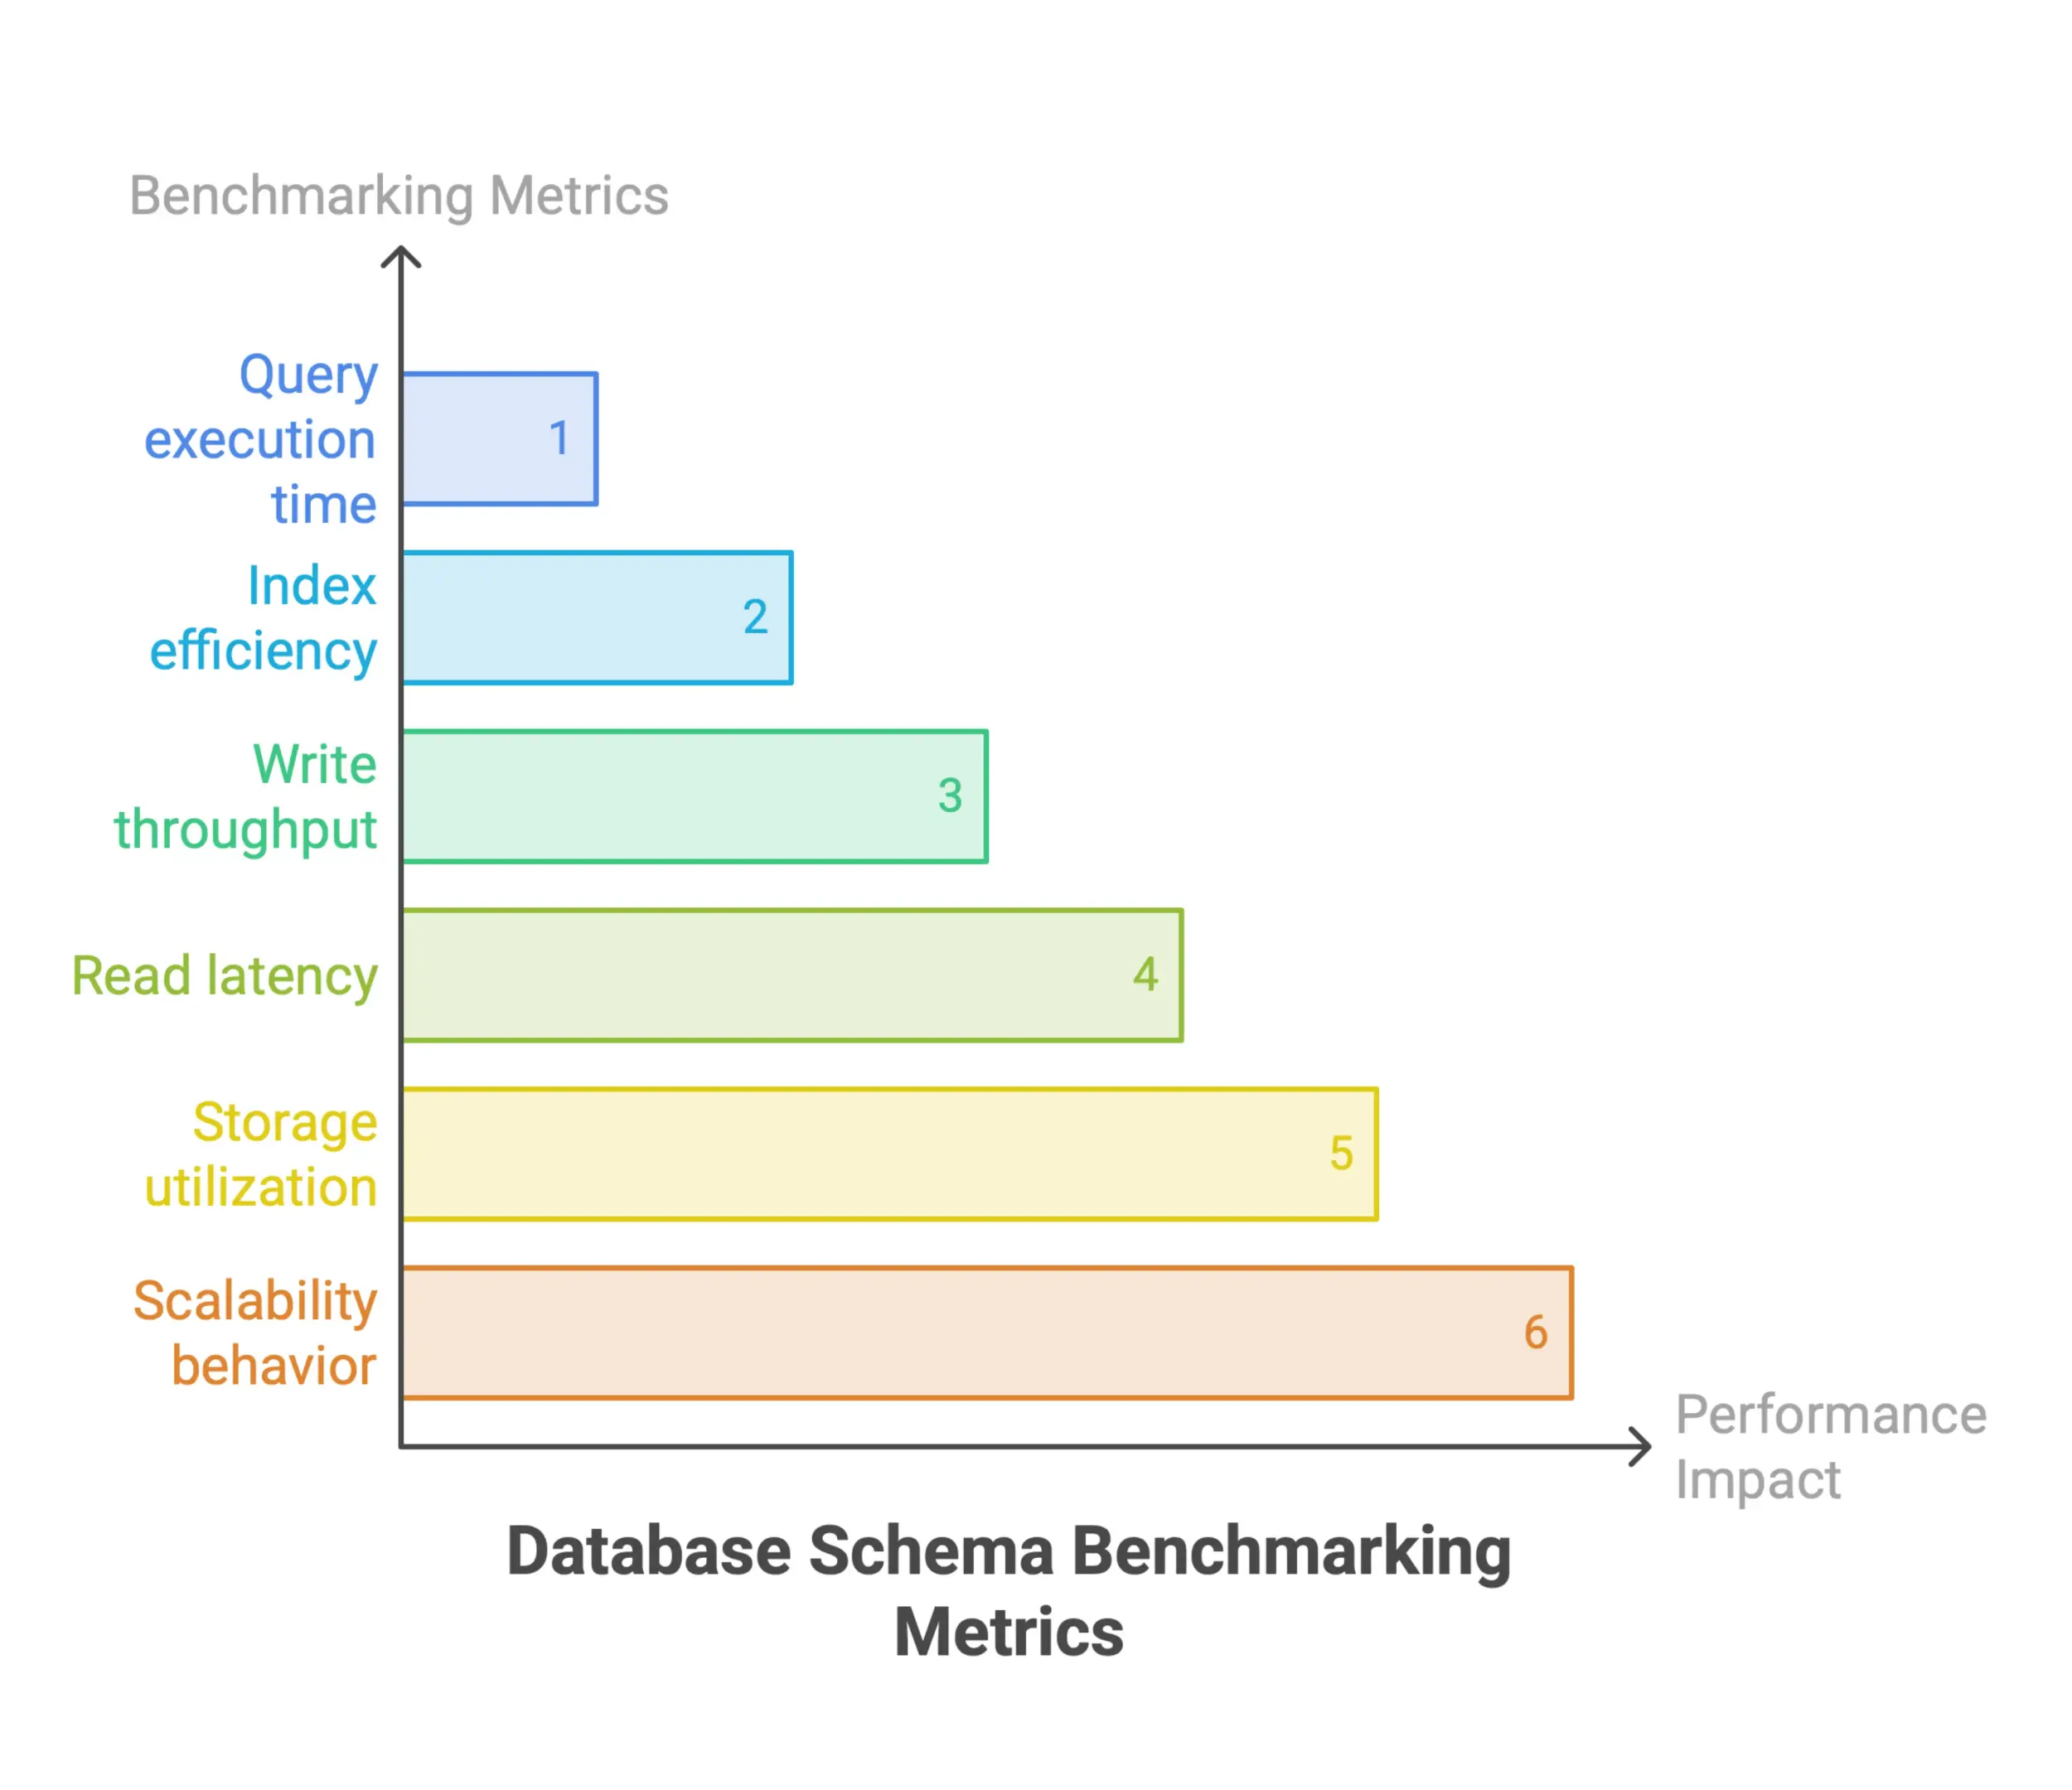
In practice, a schema benchmark usually measures:
- Query execution time across different schema layouts, including normalized and denormalized structures
- Index efficiency and how well the schema supports the application’s most common access patterns
- Write throughput and read latency under concurrent load
- Storage utilization based on schema decisions like column types and table relationships
- Scalability behavior as data volume grows and queries become more complex
What makes schema benchmarking different from general database performance testing is its focus on the design layer. Two databases running on the same hardware can behave very differently depending on how the schema is built. A weak schema creates bottlenecks that hardware upgrades or query tuning can only partially fix.
Good benchmarks are repeatable, too. They use a controlled test environment, a representative dataset, and a realistic workload, whether in synthetic benchmarks or tests based on real world workloads, so teams can compare results across schema versions, database engines, or cloud options without arguing over whether the test itself changed.
Those workload inputs can be trace-based or built from synthetic data, as long as they stay representative and repeatable.
Why Schema Benchmarks Matter for CIOs, CTOs, Data Leaders, and Product Teams
Schema decisions made early in a project tend to stick around. If the design performs badly, the fix usually comes later, when it is more expensive and riskier to change. Migration, refactoring, and re-platforming are all much harder once the system is already live and users depend on it.
That is why schema benchmarking is more than a technical exercise. It is a decision tool.
For CIOs and CTOs, benchmarks provide evidence for infrastructure investment. When you are comparing database platforms or a cloud provider, a schema benchmark based on your actual workload is far more useful than vendor performance claims, because results can vary significantly from one provider to another and teams should test on the platform they are actually considering. It shifts the conversation away from polished benchmark numbers and toward results that reflect the environment you actually run, helping leaders make informed decisions and validate non-functional properties beyond headline speed claims.
For data leaders and architects, benchmarking at the schema stage reduces architectural risk. Testing multiple schema options against the same workload before making a decision creates a clear record of why one design was chosen over another. It also exposes trade-offs early, such as whether a more normalized structure slows writes in ways that matter to the application.
For product teams, schema performance shows up directly in the user experience. Poor schema design can lead to sluggish screens, long load times, and unreliable behavior when traffic spikes. Benchmarking before release helps teams catch those problems before customers do.
Across all of these roles, the value is the same: less risk. Schema benchmarks turn assumptions into measured evidence, so teams can validate or challenge design choices before they become expensive commitments.
Key Concepts in Database Schema Benchmarking
A shared vocabulary keeps benchmarking conversations grounded, especially when technical and non-technical stakeholders are making decisions together. These are the core concepts to keep in view:
Benchmarking database schema
This is the practice of measuring performance at the schema design level, not just at the database engine level. It considers table structure, relationships, indexing strategy, and data types as factors that shape query latency, throughput, storage use, and cost.
Database Performance Benchmark
This is the broader category covering any structured test of how a database system performs under a defined workload. Schema benchmarks sit inside this category, but they treat design choices as the main variable rather than hardware, engine configuration, or cloud instance size.
Schema Design Benchmark
This is a focused comparison of two or more schema designs using the same dataset and query workload. It is especially useful during architecture selection, when teams are choosing between options like star schema and snowflake schema for analytics, or normalized and flat structures for transactional systems.
OLTP vs OLAP Benchmarking
One of the most important distinctions in schema benchmarking is whether the workload is transactional or analytical. Online Transaction Processing workloads need fast, high-volume row-level operations, which usually favors normalized schemas with focused indexing. Online Analytical Processing workloads involve large aggregations and broad reads, which often perform better with denormalized or columnar schema designs.
A schema that works well for OLTP will often struggle with OLAP queries, and the reverse is just as true. Benchmarking against both workload types, or clearly defining which one matters most, is essential if you want design decisions that hold up in production.
Getting this distinction right early helps teams avoid building schemas that look fine in development but fall apart once real query patterns start hitting the system at scale.
As teams evaluate schema options, it can also help to compare approaches against a broader benchmarking model and understand the role of cost modelling for benchmarking in validating design choices.
Benchmark Goals and Workload Scope: Match the Test to the Business Use Case
Before you write a single query or stand up a test environment, answer one basic question: what are you actually trying to measure?
Database benchmarking without a clear workload scope is a bit like testing a race car in city traffic. The numbers may be real, but they tell you very little about how the system performs where it matters.
Teams that skip this step often benchmark the wrong schema, track the wrong metrics, and make architecture decisions that do not hold up in production. You need to know early whether the workload is mainly OLTP, OLAP, hybrid transactional and analytical, AI-driven, or tied to a migration or resilience scenario. That choice shapes everything that follows, from schema design to success criteria.
Different Workloads Require Different Schema Benchmarks
Not every database is built for the same job, and not every benchmark schema reveals the same behavior. Workload simulation should recreate realistic query patterns with specialized tools, not ad hoc scripts. An OLTP system processing thousands of short, concurrent transactions per second has very different schema needs than a data warehouse running long aggregation queries across billions of rows. Treat those workloads as the same, and the benchmark will mislead you more often than it helps.
That is why workload classification comes first. Once the workload type is clear, you can make deliberate choices around:
- Table structure and cardinality: High-cardinality, normalized tables are usually a better fit for OLTP, while wide, denormalized tables are more common in OLAP
- Index strategy: Row-level lookups and column-oriented scans stress schemas in very different ways, so indexing needs to reflect that
- Data volume and distribution: A schema that scales cleanly for one workload may be irrelevant for another
- Concurrency patterns: Read-heavy, write-heavy, and mixed workloads all expose different pressure points across database operations such as reads, writes, and batch processes
Getting the workload type right also helps avoid a common mistake: benchmarking a schema that is technically sound but wrong for the scenario. A design built for analytics will not surface the same bottlenecks that matter in a high-frequency transactional system, and the reverse is just as true for specific use cases.
OLTP Benchmarking: Isolating Core Transaction Behavior
When you benchmark OLTP workloads, the schema should isolate transactional behavior without adding noise from unrelated design choices. That is harder than it sounds. Production schemas often carry baggage from old decisions, operational constraints, or business rules that have little to do with raw performance.
A well-built OLTP benchmark schema is intentional. It separates tables by role, usually distinguishing between fixed-size tables, tables that scale with transaction volume, and tables that grow continuously over time. Each category puts different pressure on the database engine. If you mix them together too casually, it becomes much harder to see where bottlenecks are actually coming from.
A useful example is Microsoft Learn, where the DTU benchmark for Azure SQL uses a six-table schema divided into fixed-size, scaling, and growing tables. It includes a mix of integer, numeric, character, and date or time columns, with only primary and secondary keys defined and no foreign keys. That omission matters. Foreign key checks can add overhead that varies across engines and configurations, so leaving them out makes it easier to isolate raw transaction throughput, while changing multiple factors at once can skew benchmark results when you are trying to isolate transaction behavior.
The broader idea is straightforward: a strong OLTP benchmark schema stays focused. It strips away variables that do not help answer the question at hand, so the results reflect the workload being measured instead of all the extra complexity around it.
For teams designing their own OLTP benchmark schemas, that means:
- Using realistic column type distributions that match actual transaction data for both read and write operations
- Avoiding schemas that are too normalized or not normalized enough compared to production
- Controlling for referential integrity overhead if that is not part of the test
- Making sure table sizes line up with the transaction volume the system is expected to handle for capacity planning
Decision Criteria: Latency, Throughput, Cost, Maintainability, and Operational Risk
Once you define the workload, you know what to test. Once you define the success criteria, you know how to read the results through relevant performance metrics. Without those criteria in place before the benchmark starts, teams often optimize for whichever number looks best instead of the number that actually matters.
Most benchmarking scenarios should evaluate five criteria:
Latency measures how long individual operations take. For OLTP, that usually means transaction response time at a given concurrency level. For analytics, that means query execution time at scale. Latency is the metric users feel most directly, which is why business stakeholders tend to care about it quickly.
Throughput measures how much work the system can complete in a fixed time, usually transactions per second or queries per hour. Throughput and latency are closely related, but not always in a simple way. A system tuned for maximum throughput may accept slower individual responses. If you only measure one of the two, you miss part of the picture.
Cost matters more as benchmarking moves into cloud-managed database services. Schema choices affect resource usage, and resource usage affects spend. A setup that looks strong on paper may not be practical once you account for real operating cost, especially when database configuration changes both spend and measured outcomes.
Maintainability is easy to overlook in technical evaluations, but it has a real impact over time. A schema that performs well in a controlled test but demands constant index tuning, frequent migrations, or awkward query changes can become a maintenance burden. That is not a win. It is deferred pain.
Operational risk includes recovery behavior, failure handling, and performance under sudden load. Resilience-focused benchmarks need schemas and workloads that expose those edge cases clearly, not hide them.
The criteria you choose should map directly back to the business use case you defined at the start. An internal analytics platform may accept higher latency if it keeps cost down. A customer-facing transactional system usually cannot. When benchmark criteria match the real business requirement, the results are far more likely to be actionable.
For teams turning historical project evidence into database decisions, historical project cost planning and cost normalization are especially relevant when benchmarking database-driven workflows. Teams may also need to track other parameters such as availability or workload-specific constraints depending on the business case.
Schema Shape Comparisons: Star Schema vs Flat Table vs Normalized Models
Schema design has long-term consequences. It affects query performance, storage costs, and how easy the system is to maintain as requirements change. Even so, many engineering and data teams reuse the same schema pattern regardless of database engine. That assumption can quietly slow things down in ways that are hard to spot without proper benchmarking.
Before committing to an architecture, it pays to understand how schema shape behaves on the target system.
Why Denormalization Is Not Always a Performance Win
In data engineering, there is a common belief that flattening a schema automatically makes queries faster. The logic sounds reasonable: fewer joins should mean less work. But real systems are messier than that, and benchmark data shows why.
A 2024 cloud data warehouse study published via ICEIS / SciTePress used the Star Schema Benchmark to compare schema shapes across multiple database systems. The results were hard to ignore. In Amazon Redshift, the star schema completed the full OLAP workload 74% faster than the flat table version. In MariaDB Columnstore, the star schema was 63% faster. Those are not minor differences. They are the kind of gaps that can directly affect response times in production analytics environments.
Denormalization also comes with trade-offs beyond raw speed:
- More storage used because attribute data gets repeated
- More work when updating or refreshing dimension data
- Higher risk of inconsistency across large flat tables

So if a team flattens a model expecting a performance boost, but the target engine actually performs better with a star schema, the result can be a system that is both slower and harder to maintain. That is why benchmarking the actual schema shape on the actual database engine is essential, not optional.
How Query Optimizers, Storage Engines, and Join Strategies Change Benchmark Results
Schema shape performs differently from one system to another because each database engine works differently under the hood. Query optimizers, storage layouts, and join execution strategies vary widely between columnar engines, row-based databases, and distributed cloud warehouses. On paper, this looks like a schema choice. In practice, it is a close interaction between data structure and engine behavior.
Columnar storage engines are built to read only the columns needed for a query. That means a normalized or star schema, with smaller tables and tighter column access patterns, can line up very well with the engine. A flat table may keep all the data in one place, but it can still force the engine to process columns that are irrelevant to the query.
Distributed systems add another layer. Partition pruning, data distribution keys, and broadcast join strategies all influence how schema shape performs. A star schema with a well-distributed fact table and smaller dimension tables may let the engine broadcast dimensions efficiently instead of moving large volumes of data across nodes.
The ICEIS / SciTePress study makes this point clearly. The same workload, tested against the same schema shapes, produced different rankings depending on the database system. There is no universal best choice because the engine architecture is part of the equation.
For technical decision-makers, the takeaway is simple: do not use benchmark results from one database to justify schema choices in another. Each system needs to be evaluated on its own terms.
Long-Tail Topic Angle: Cloud Database Benchmarking—Star Schema vs Flat Table Performance in Cloud Data Warehouses
For teams comparing cloud data warehouse options, the Star Schema Benchmark offers a structured and repeatable way to measure schema performance across tools. It uses an OLAP workload built around a star schema, which makes it especially relevant for analytics, reporting, and business intelligence workloads.
In cloud database benchmarking, the 2024 study referenced through ICEIS / SciTePress applied that approach across warehouse platforms and surfaced results that should make any architect pause before assuming one schema shape always wins. Redshift and MariaDB Columnstore both favored the star schema by a wide margin, but SingleStore told a different story. In that system, the flat table schema was 42% faster than the star schema for the same workload.
A few practical lessons come out of that:
- Do not carry benchmark comparisons across different configurations. A result in Redshift does not tell you what will happen in SingleStore or another engine.
- Test your actual workload, not just generic benchmarks. The Star Schema Benchmark is a useful baseline, but your query patterns, data volumes, and join complexity should drive the final decision.
- Account for operational overhead as well as speed. A flat table may look attractive in one system, but it can still create maintenance and consistency problems that raise long-term cost.
Cloud data warehouse selection is often framed as a cost decision or an ecosystem decision. Schema benchmarking adds another layer: architectural fit. Getting that right before you commit to a platform can save a lot of engineering time later.
If benchmarking schema shape is part of your cost analysis process, cost benchmarking tools can help connect these results to historical project cost evidence.
Controlled Benchmark Engineering: Make Schema Tests Reproducible and Comparable
Database benchmarking is only useful if the results can be trusted, repeated, and defended. Without a clear structure, performance testing turns into a fragile one-off exercise. Change the dataset, move to a different platform, or revisit the numbers six months later, and the whole thing can stop making sense.
A better approach is to treat benchmarking like an engineering discipline, with defined inputs, traceable outputs, and a consistent method from end to end.
Treat Benchmarks as an Engineering Process, Not a One-Off Test
Too many teams run benchmarks the way they handle fire drills: occasionally, under pressure, and with little documentation. That usually leaves behind a pile of numbers that nobody can reproduce or compare with confidence.
A stronger approach treats benchmarking as a repeatable engineering process—a database benchmarking process—with clear stages and artifacts. According to arXiv, a 2026 paper on benchmark engineering for heterogeneous information systems makes this case directly, arguing that benchmarks should be built with explicit structure instead of assembled ad hoc.
In practical terms, that means:
- Defining benchmark inputs before any testing starts
- Versioning schemas and datasets alongside the code
- Documenting the mapping between conceptual data models and physical implementations
- Storing results in a format that supports comparison over time
When benchmarks are engineered instead of improvised, teams can revisit them after schema changes, platform migrations, or tuning or version updates and still draw useful conclusions. That saves time and avoids starting from scratch every time something changes.
Define Schema Categories, Instance Categories, and Mappings
A key idea in structured benchmark engineering is keeping the conceptual model of the data separate from the physical schema that implements it. They are related, but they are not the same thing. Mixing them up is one of the fastest ways to produce unreliable results.
The arXiv paper lays out a framework built around three distinct pieces:
- Schema categories: The structural definition of the data model, independent of any specific database system
- Instance categories: The actual datasets that populate those schemas, also defined independently of the platform
- Mappings: The explicit links between schema categories and instance categories, showing how conceptual data is translated into a physical implementation
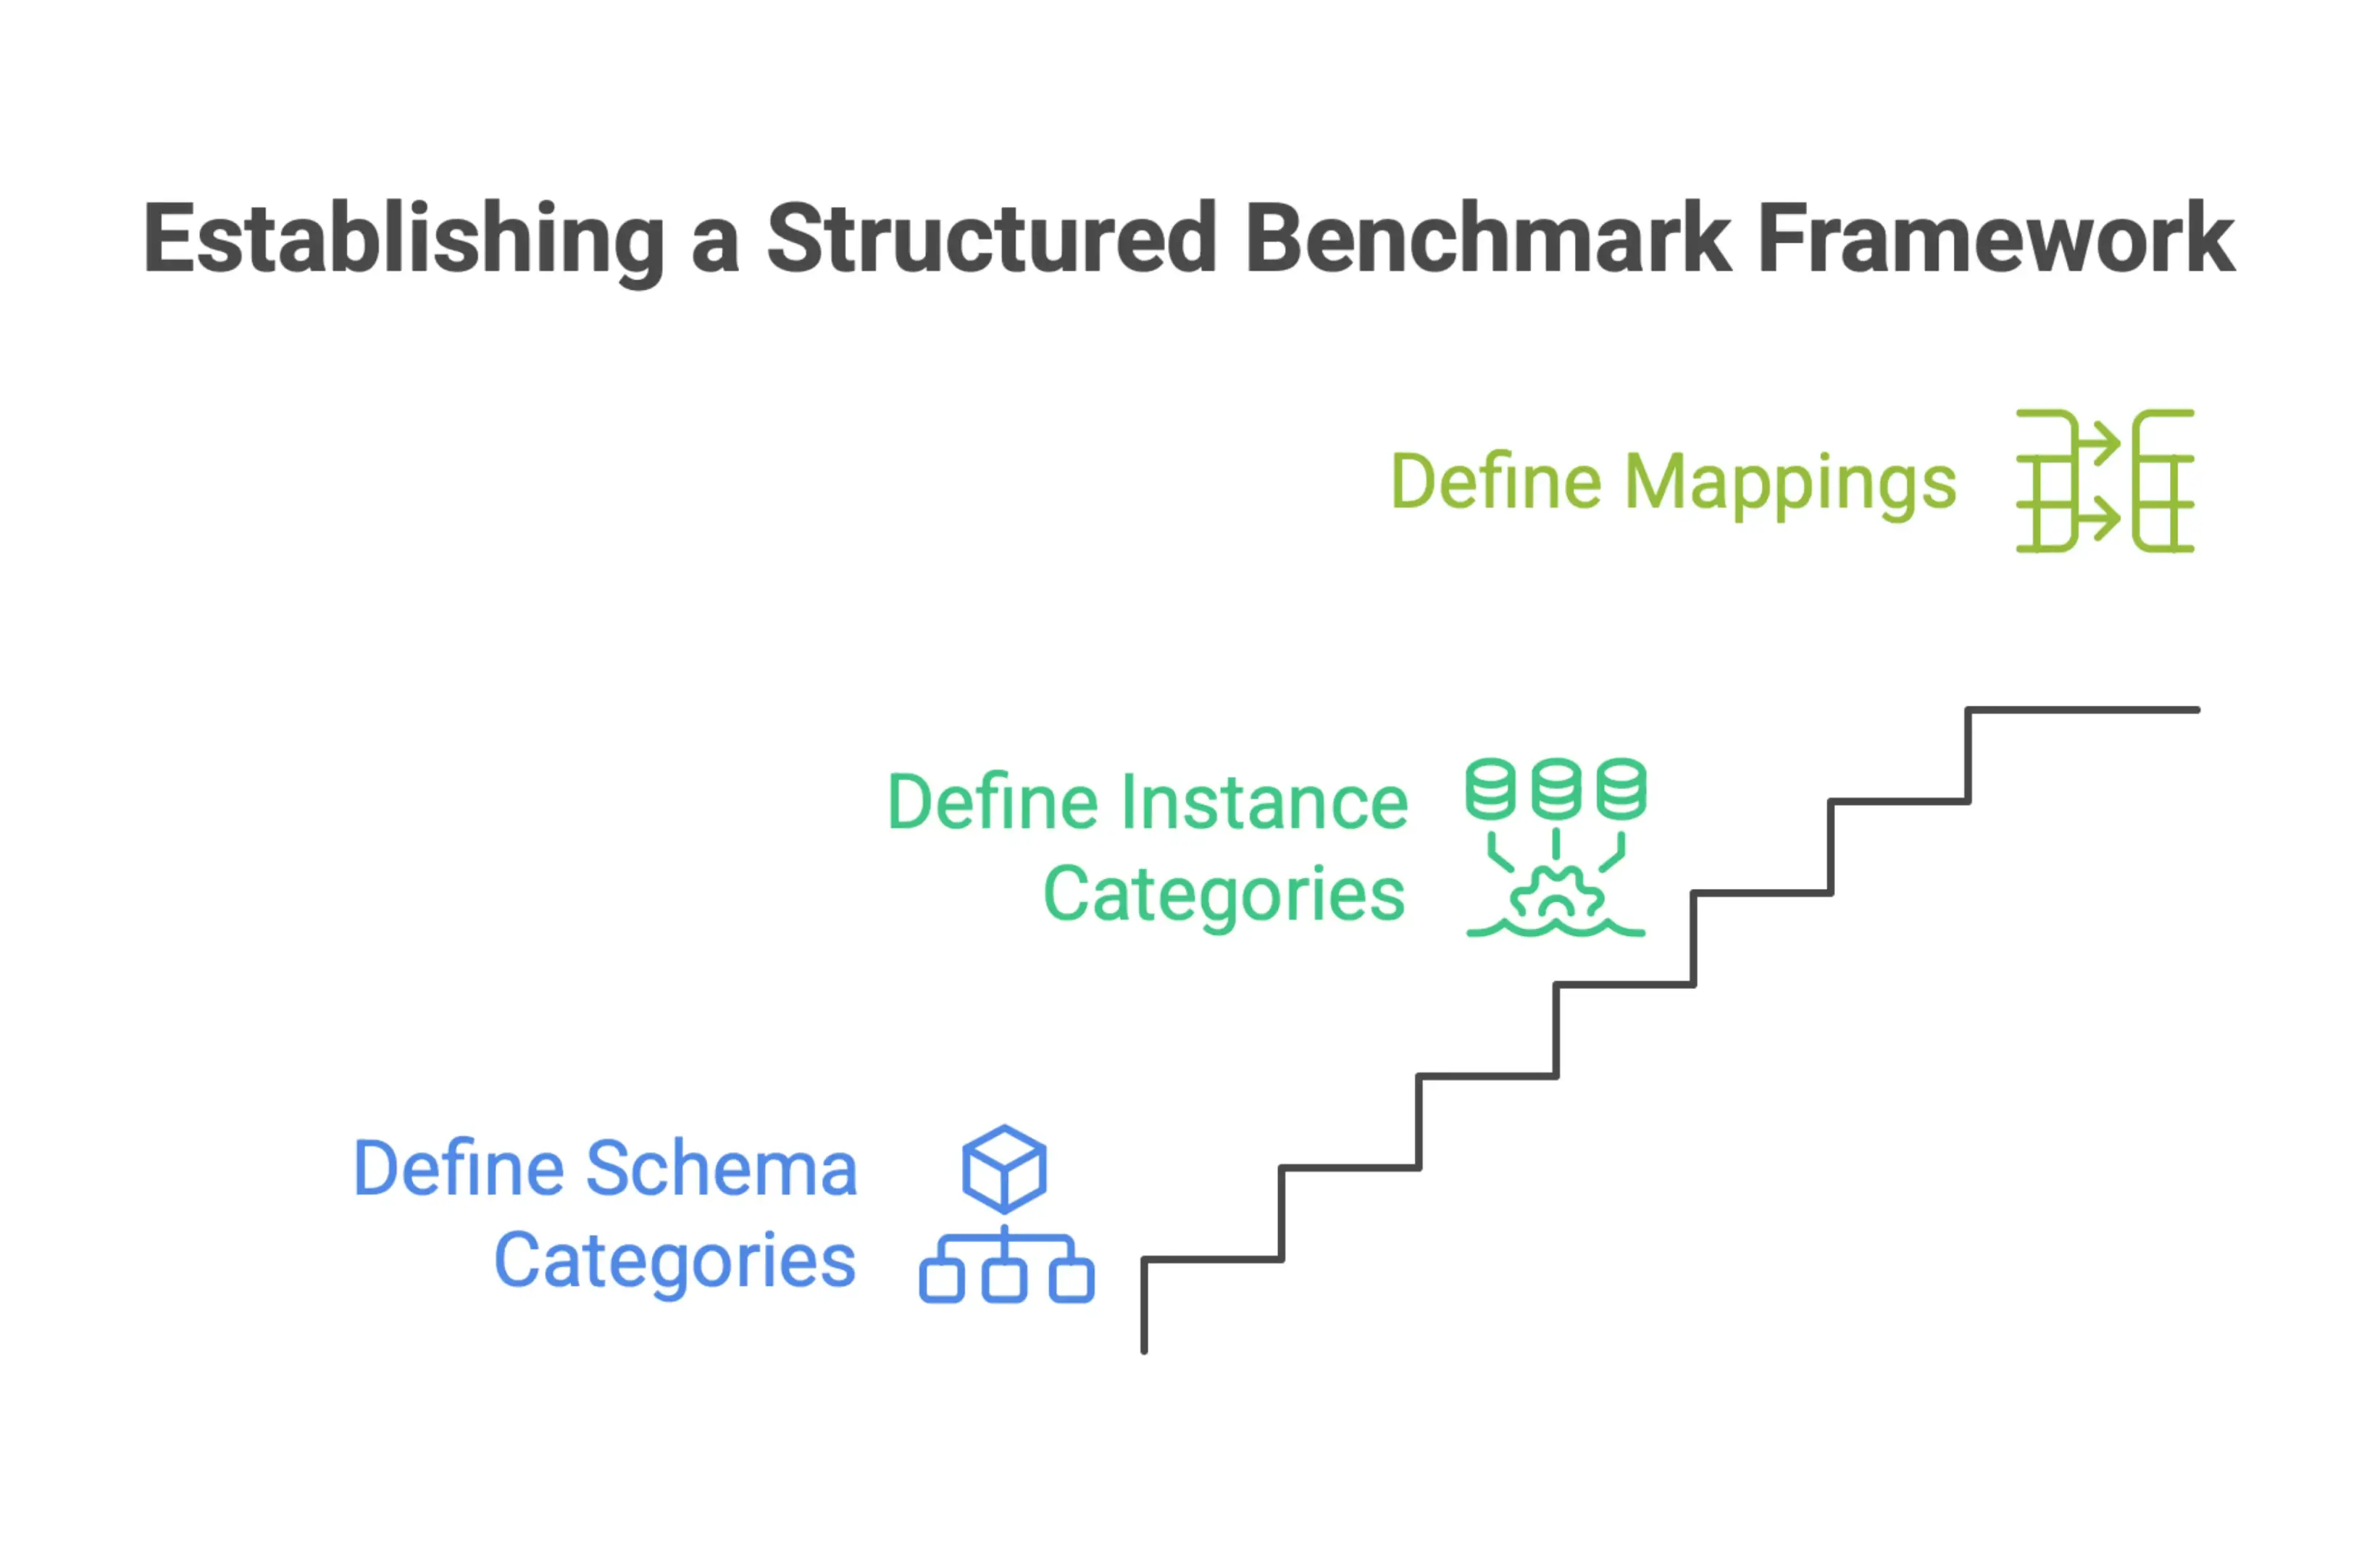
This separation matters in real projects. If your schema category is defined clearly, the same conceptual dataset can be mapped to relational databases, a nosql database, or a graph model without treating each one as a completely different benchmark. The dataset stays the same. Only the mapping changes.
For teams working across multiple database platforms or evaluating schema migrations, this gives you the audit trail needed to understand why one setup performs differently from another. It also makes variable isolation much easier because you can see exactly what changed between test runs. That structure also helps compare different database products fairly when teams are evaluating alternatives.
How to Compare Alternative Schema Designs Across Heterogeneous Systems
Comparing schema performance across heterogeneous systems is one of the biggest challenges in schema benchmarking. Without a shared framework, the results may be technically correct but still hard to compare in a meaningful way because the schema designs were never aligned in the first place.
The approach described in arXiv solves that by supporting multiple structural representations of the same conceptual dataset. Instead of building a separate benchmark for every system, teams can define one schema category and then create multiple mappings to different physical implementations. Each one represents an alternative schema design, but all of them are based on the same underlying data model.
That makes cross-system comparison reproducible in a way that actually matters. You are not comparing two different datasets on two different systems. You are comparing two schema designs against the same logical data, which is the comparison that informs real architecture decisions.
Key benefits of this approach include:
- Controlled schema evolution: Introduce schema variants step by step and measure the impact of each change
- Auditability: Every design decision connects back to a defined mapping, so results can be reviewed and challenged
- Portability: The same conceptual benchmark can be reused on new platforms as they are evaluated, without rebuilding the entire test suite
For engineering teams comparing relational, NoSQL, or hybrid systems, this kind of structured framework supports more informed decisions across database vendors in performance testing. It also gives teams using tools like Nomitech a more reliable way to baseline schema changes and compare results across environments without losing consistency.
Data Type and Storage Choices: Benchmark the Physical Consequences of Logical Design
Every schema decision you make at design time has a physical cost, and teams usually feel that cost once the system is under real load. The column types you pick, the indexes you create, and the storage formats you allow all affect latency, storage usage, and what it costs to run the database at scale.
Benchmarking those choices early, before the schema hardens, gives teams the evidence they need to make better architectural trade-offs.
JSONB vs Typed Columns: Benchmarking Flexibility Against Performance and Storage Cost
JSONB columns are useful when teams need schema flexibility or have to support variable data structures without constant migrations. But that flexibility comes with a cost, and benchmarks make it hard to ignore.
According to DigitalApplied, a PostgreSQL schema benchmark on a 50,000 row dataset found that querying bare JSONB took about 3.2 seconds, compared with just 0.02 seconds for the equivalent typed column query. That is roughly 160 times slower. The storage difference was just as sharp. At one million rows, JSONB used around 26 MB versus 4 MB for typed columns, which works out to a 6.5x storage overhead.
Those are not small gaps. If you are designing a schema that needs to scale into the millions of rows, that extra storage adds up quickly and turns directly into higher cloud spend. From a benchmarking standpoint, any schema that relies heavily on JSONB should be tested for both query latency and storage footprint at realistic data volumes, not just checked for functional correctness in a small development environment.
A useful benchmark framework for this comparison includes:
- Query execution time for reads and filtered lookups
- Index behavior on JSONB paths versus native typed columns
- Storage size at defined row count milestones
- Query planner behavior under different data distributions
The benchmark results should lead to a deliberate choice. Use JSONB where the flexibility is worth the overhead, and favor typed columns where performance and storage efficiency matter most.
Vector Columns and AI-Native Schema Benchmarking
As AI-native applications move into production, new schema primitives are becoming part of the conversation. Vector columns, which store high-dimensional embeddings for semantic search and similarity workloads, bring benchmark requirements that do not fit neatly into traditional relational testing.
Microsoft Learn provides guidance for benchmarking SQL Server 2025 vector workloads, noting that while index creation needs at least 100 rows, meaningful benchmark results require much larger datasets. The key metrics for vector schema benchmarks include:
- Vector index build time: How long does it take to construct the index as the dataset grows?
- Query latency: What is the end-to-end response time for similarity searches?
- Queries per second QPS: How does throughput hold up under concurrent load?
- DML impact: How do insert, update, and delete operations affect index integrity and query performance over time?
That last point matters. Vector indexes are not static. As embeddings are added or updated, the index has to adapt. Benchmarking DML impact gives you a realistic view of operational behavior, not just cold-start performance.
The broader lesson is simple. New schema types need purpose-built benchmarks. Standard OLTP metrics are not enough when your schema includes vector columns built for AI retrieval workloads. The benchmark has to reflect the actual query patterns and write volumes your application will generate.
How Data Type Selection Impacts Indexing, Compression, Query Plans, and Cloud Spend
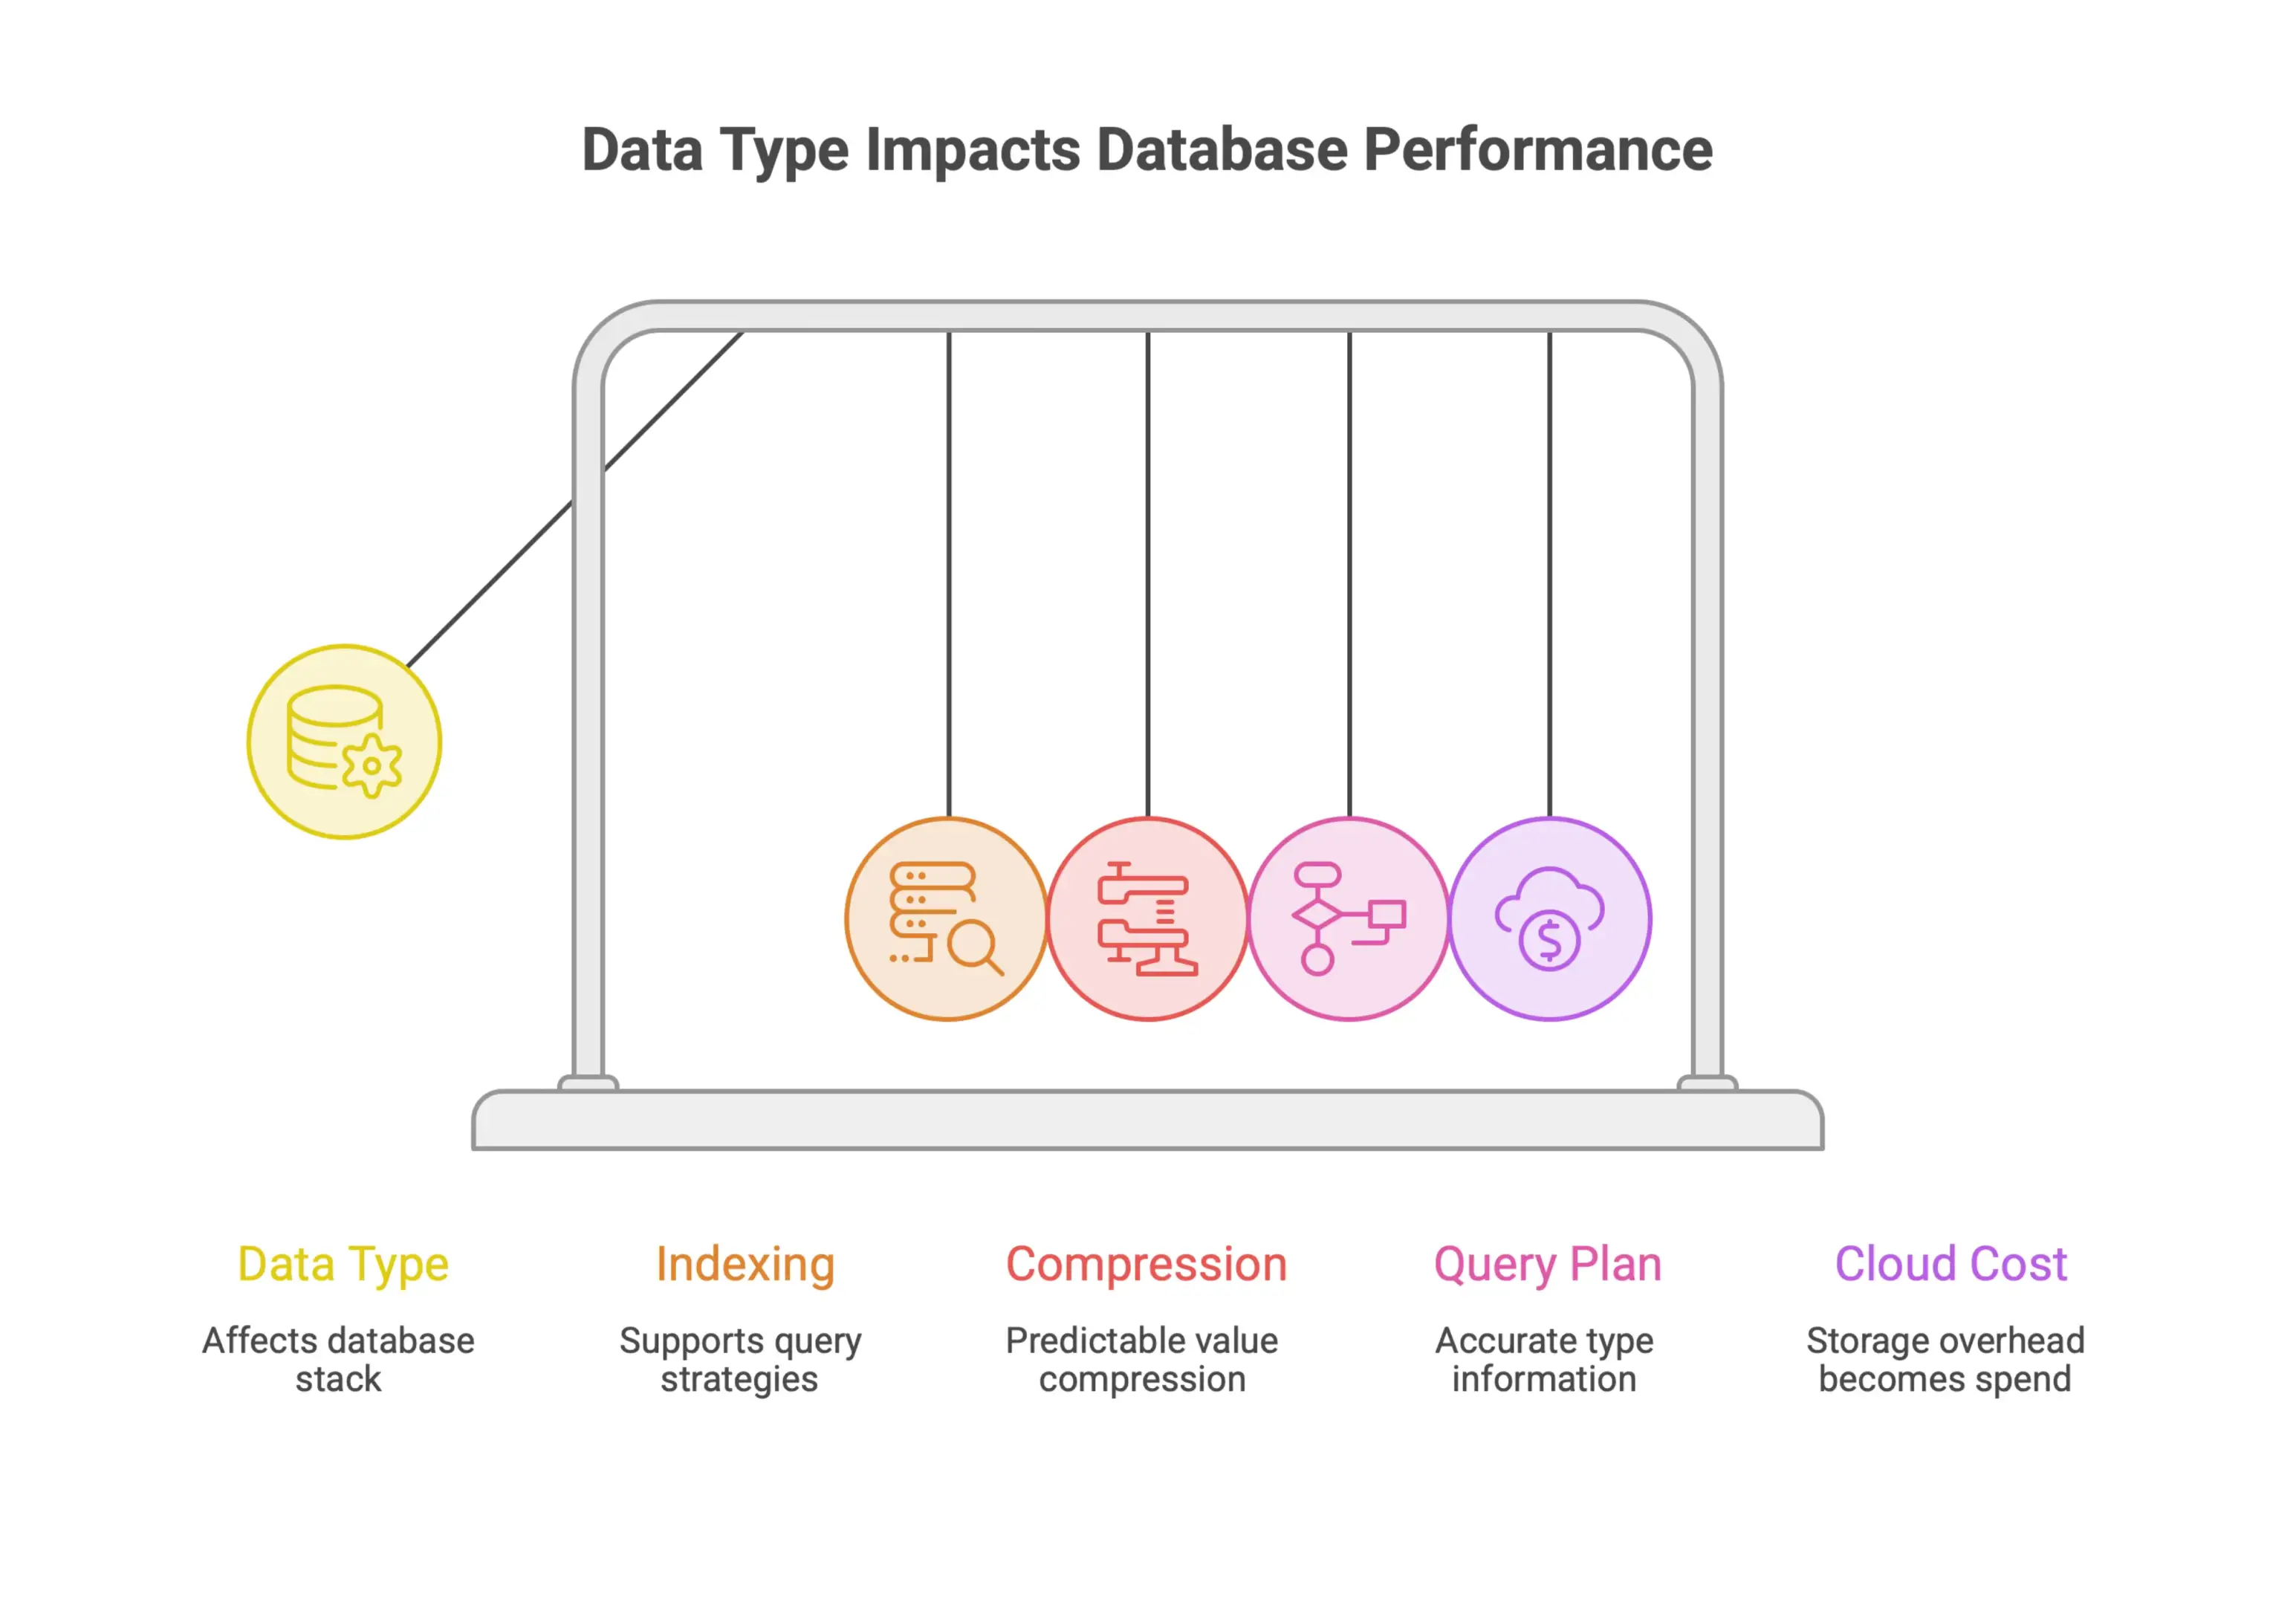
Data type choices affect every layer of the database stack. Whether you store an ID as a native integer or a string, use a typed date column or text, or represent a boolean properly instead of with a single-character flag, those decisions shape how the query planner builds execution plans, how well the storage engine compresses data, and how efficiently indexes can be built and used.
The JSONB benchmark data from DigitalApplied makes this especially clear. The 6.5x storage gap between JSONB and typed columns at scale is not just about disk usage. It also reflects how well each format compresses, how accurately the optimizer can work with strongly typed data, and how effectively indexes can be built on predictable column structures.
When benchmarking data type selection, it helps to look at four dimensions:
- Indexing efficiency: Does the chosen type support the index strategies your queries need? How do index size and build time compare across alternatives?
- Compression ratios: Typed columns with consistent values usually compress more predictably than semi-structured formats, which affects both storage cost and I/O performance.
- Query plan quality: The optimizer works best when it has accurate type information. Running the same query across different representations shows how much the plan changes.
- Cloud storage and compute cost: At scale, storage overhead becomes real infrastructure spend. A schema that is 6.5x larger by design is also much more expensive to store, back up, and move around.
Treating data type selection as something to benchmark, not just something to decide in design review, gives engineering teams the proof they need to push back on convenient schema choices before they become expensive operational limits.
For benchmarking-heavy cost analysis, historical cost data and benchmark databases are the most relevant product capabilities.
Operational Resilience: Benchmark Schemas Under Migrations, Failures, and Stress Testing
Most database teams put serious effort into performance testing, but there is still a big gap between what traditional benchmarks measure and what production systems actually go through. Query throughput on a quiet cluster tells you very little about how a schema will behave during a live migration, a regional failover, or a backup window that lands in the middle of peak traffic.
Closing that gap takes a different kind of benchmark.
Why Steady-State Database Benchmarks Are Not Enough
Standard benchmarks are built to measure performance under ideal conditions: a fully initialized cluster, predictable workload patterns, and no competing operational activity. That is useful, but it is not real life, which is why stress testing matters when failures and competing activity push the system beyond steady-state behavior.
Production databases are under pressure from multiple sides at once. Schema changes roll out while users are actively transacting. Backups run on schedules that do not always match traffic patterns. Change data capture pipelines add replication overhead. Nodes fail unexpectedly, and in distributed systems, whole regions can go offline. This kind of test often exposes existing problems that steady-state benchmarks miss.
This is exactly the problem that Cockroach Labs tackled in their 2025 "Performance under Adversity" benchmark. Instead of treating the traditional TPC-C model as a pure steady-state throughput test, they reworked it to simulate seven different levels of operational stress, including schema changes, backup operations, CDC activity, node restarts, and regional outages. The idea is simple. If your benchmark does not include failure conditions, it cannot tell you whether your schema will hold up when it really matters.
Steady-state numbers are still useful as a baseline. They just should not be the final answer. A schema that looks excellent in isolation can fall apart the moment a migration starts or a node drops out of the cluster.
Benchmarking Schema Migrations Without Business Disruption
Schema migrations are one of the most common causes of unexpected performance drops, and they are often benchmarked before and after version updates because both can change performance unexpectedly. Adding a column, changing an index, or updating a constraint might seem low risk in development. On a live production schema under load, the impact can be very different.
Good schema benchmarking treats migrations as a core test scenario, not a side note. That means:
- Running migrations while a realistic workload is active, not after the cluster has been quieted
- Measuring how throughput changes the moment the migration starts and while it is still running
- Tracking whether tail latency spikes during the migration window and how long it takes to recover once the operation finishes
- Testing rollback behavior if a migration has to be reversed under load
Migration benchmarking helps reduce existing problems in live database setups by exposing safe tuning targets before rollout.
The Cockroach Labs approach of folding schema changes directly into the benchmark workload reflects that thinking. By treating migrations as one of several stressors running at the same time, instead of a separate event, the benchmark produces results that are much closer to what engineering teams actually face in production.
The goal is not just to confirm that a migration completes. It is to understand how much performance the system gives up while that migration is happening, and whether that trade-off stays within operational limits.
Operational Metrics to Track: Availability, Recovery Time, Tail Latency, and Throughput Degradation
Once you start benchmarking under adverse conditions, the metrics need to widen as well. Standard throughput alone is not enough. These performance metrics and resilience metrics give a much clearer view of schema resilience:
Availability measures whether the database continues serving requests during and after a disruptive event. A schema that looks efficient on paper may still struggle to maintain high availability during node failures or regional outages. Availability should be tracked continuously across every failure scenario, not just at steady state. Resilience-focused database benchmark results can include Aerospike sustaining over 600,000 transactions per second during node failure.
Recovery Time captures how quickly the system returns to normal after a disruption. That includes node restarts, failed migrations, and regional recovery events. In many real environments, faster recovery matters more than peak throughput, especially when SLAs are tight.
Tail Latency reflects the slowest requests in the system, usually measured at the 99th or 99.9th percentile. During migrations and operational stress, tail latency often jumps even when median latency looks fine. If your benchmark only reports averages, those spikes will stay hidden until users feel them.
Throughput Degradation measures how much transaction capacity drops during a stress event. Knowing a system can handle 10,000 transactions per second at steady state is useful. Knowing it falls to 6,000 during a backup window or CDC replication event is what helps teams plan properly.
The Cockroach Labs benchmark framework, which includes schema changes, backups, CDC, node restarts, and regional outages as structured test conditions, shows why these metrics need to be evaluated together. Optimizing for one in isolation can lead to misleading conclusions. A schema that preserves throughput during a migration may do so at the cost of availability or much worse tail latency somewhere else.
Building operational resilience into benchmarking is not about finding a flawless schema. It is about understanding the real performance envelope your system has to operate within, so you can make informed architectural decisions before pressure forces them for you.
For benchmark-driven project planning, cost normalization and statistical cost modeling are often the right product entry points.
AI-Generated SQL and Query Pipeline Readiness: Schema Complexity as a Benchmark Dimension
As AI-driven query generation moves out of research and into production, database schema design needs to keep up. Traditional benchmarks were built to measure raw query performance. That still matters, but it is no longer enough. Today’s benchmarks also need to support automated SQL generation, natural language interfaces, and large-scale schema navigation.
In that context, schema complexity is not just a design detail. It is a core benchmarking dimension.
LLM-Generated SQL Workloads Require Detailed Benchmark Schemas
When large language models generate SQL for benchmarking, the quality and variety of those queries depend heavily on how well the schema is defined. A schema that clearly lays out tables, relationships, and common join paths gives the model enough structure to produce queries with real variation in complexity and difficulty. A sparse or vague schema usually leads to shallow, repetitive output.
That is one of the key takeaways from the PVLDB SQLStorm project, a 2025 effort that introduced LLM-generated SQL workloads as a new way to benchmark databases. The research showed that schema complexity directly affects the range of benchmark queries an automated system can produce. Without enough detail at the schema level, including clear table definitions and documented relationships, the workload loses the diversity needed to meaningfully stress-test a database environment.
For teams building or evaluating benchmarks, the practical lesson is straightforward. Schema design is no longer just an infrastructure concern. It directly shapes the quality of any AI-generated workload. If the goal is to benchmark LLM-driven SQL generation, the schema itself needs to be treated with the same care as the queries.
Key schema attributes that support effective LLM query generation include:
- Explicit foreign key relationships between tables
- Well-documented common join paths
- Enough tables and attribute variety to generate diverse query patterns
- Clear naming conventions that map well to natural language requests
Schema Linking and Text-to-SQL Evaluation for Enterprise Databases
Text-to-SQL systems turn natural language questions into executable SQL queries, and their reliability depends on how well they can identify the right tables and columns. That process, known as schema linking, becomes much harder as database size and complexity grow.
The 2025 LinkAlign paper from ACL Anthology tackles this challenge directly with a scalable schema linking approach built for large databases. The system reached 86.4% locate accuracy on Spider and 83.4% on BIRD, two widely used evaluation datasets in the text-to-SQL space. When combined with DeepSeek-R1, it achieved a state-of-the-art execution accuracy of 33.09% on Spider 2.0-Lite, a benchmark known for enterprise-scale complexity.
What makes this research especially relevant for schema benchmarking is the way it frames evaluation. The shape of the benchmark schema, specifically whether it reflects the scale and relational complexity of a real enterprise environment, is now a first-class part of assessing end-to-end query pipelines. A benchmark that is too simple will not reveal the failure modes that matter most in production text-to-SQL systems.
For organizations evaluating natural language query tools or building internal BI systems powered by LLMs, the takeaway is clear. Benchmark schemas should mirror real database characteristics as closely as possible. Oversimplified schemas can produce accuracy numbers that look good on paper but fall apart in production.
Long-Tail Topic Angle: Benchmarking Database Schemas for LLM, BI, and Natural Language Query Systems
Most database benchmarking discussions still focus on throughput and latency. But a growing set of use cases, including LLM-based query generation, BI tools with natural language interfaces, and enterprise text-to-SQL systems, calls for a different lens.
Schema complexity is becoming a measurable axis in that conversation. The research from both SQLStorm and LinkAlign points to the same underlying issue. Benchmark schemas built for traditional query performance testing are not enough for AI-driven query pipelines. They do not have the structural richness needed to generate meaningful automated workloads, and they often miss the realistic complexity required to surface schema linking failures.
For practitioners working where databases and AI overlap, that creates a practical opportunity to rethink how benchmarks are scoped and built. A schema meant to support LLM, BI, or natural language query evaluation should account for:
- Metadata volume and attribute diversity that reflects enterprise-scale databases
- Multi-table join complexity that matches real analytical query patterns
- Schema structure that supports accurate schema linking at scale
- Compatibility with automated SQL generation pipelines
As natural language interfaces to databases become more common in enterprise tools, the benchmarks used to evaluate them have to evolve as well. Schema design sits at the center of that effort, and treating it as a benchmark dimension, not an afterthought, is the right place to start.
For AI-related benchmarking programs, benchmark databases and historical project cost data are the most relevant internal product destinations.
Benchmark Metrics and Decision Framework: Turn Results Into Architecture Choices
Running a benchmark without a clear way to interpret the results is mostly just collecting numbers. The data only becomes useful when you know which metrics matter, what realistic test conditions look like, and how to turn the findings into a confident architecture decision.
This section gives you that framework.
Core Metrics: Query Latency, Throughput, Build Time, Storage Footprint, Cost per Query, and DML Impact
Good database schema benchmarking starts with the right metrics, and good database benchmarking tools are needed to capture the right metrics consistently across runs. Each one tells part of the story. If you focus on only one or two, you will miss the trade-offs that usually matter most in production.
Here is what each metric reveals:
- Query Latency measures how long a query takes to return results. It is the clearest signal of user experience, especially in interactive applications where every second is visible.
- Throughput shows how many queries or transactions the system can handle in a given time. This matters most in batch jobs or systems with heavy concurrent use, and widely cited benchmarks often trace back to standards from the Transaction Processing Performance Council.
- Build Time tracks how long it takes to create indexes, materialized views, or schema transformations. A schema that delivers fast reads but takes too long to rebuild can become a problem in environments with frequent refresh cycles.
- Storage Footprint captures the total disk space used by the schema, including indexes and any extra structures. Smaller footprints can lower infrastructure cost, but they are not worth much if they hurt query performance.
- Cost per Query ties performance directly to spend, which is especially important in cloud environments where compute and I/O are billed continuously. A schema that looks efficient on paper can get expensive if every query scans more data than it should.
- DML Impact measures the effect of inserts, updates, and deletes on system performance. Schemas with heavy indexing or materialized views often pay for faster reads with slower writes, and heavy indexing can also create performance differences across configurations even when query latency looks similar.

Taken together, these six metrics give you a much clearer picture. A schema that looks great on latency but performs poorly on DML impact may be fine for read-heavy analytics, but it can fall apart in an operational database with constant writes.
How to Avoid Benchmarking Pitfalls: Biased Workloads, Unrealistic Data Volumes, and Missing Operational Scenarios
Even a well-run benchmark can point you in the wrong direction if the test design is flawed. Three issues come up again and again, and they are worth addressing before you start.
Biased workloads happen when the benchmark only reflects the easiest case for one schema design. For example, if the test set is made up entirely of simple point lookups on a schema built for exactly that pattern, the results will look excellent. But they will not hold up once the application starts mixing joins, filters, and unpredictable query shapes. A useful workload mix should reflect how the system is actually used, not how you hope it will be used.
Unrealistic data volumes can distort the results in both directions. Small datasets often hide performance problems that only show up at scale. On the other hand, using data that does not resemble production distribution can make indexes and partitions look better or worse than they really are. Serious benchmarks should use a non-trivial dataset size of around 1 TB when production scale justifies it. Schema decisions around partitioning, clustering, and indexing behave differently as volume grows, so the test data needs to be close to real-world conditions.
Missing operational scenarios are easy to overlook, but they can make a benchmark misleading. Too many tests focus only on read speed and ignore the reality of concurrent writes, schema changes, index rebuilds, backup jobs, and query contention. A schema that performs well in isolation may slow down once those background activities are running. Benchmarking should reflect the full life of the database, not just a clean read-only test.
Fixing these three issues early will make your results far more reliable and far more useful when it is time to choose a design. For NoSQL testing, the Yahoo! Cloud Serving Benchmark (YCSB) is a standard option for benchmarking a NoSQL database, Apache Cassandra, and other NoSQL databases under controlled workloads.
Executive Checklist for Choosing the Right Database Schema Based on Benchmark Results
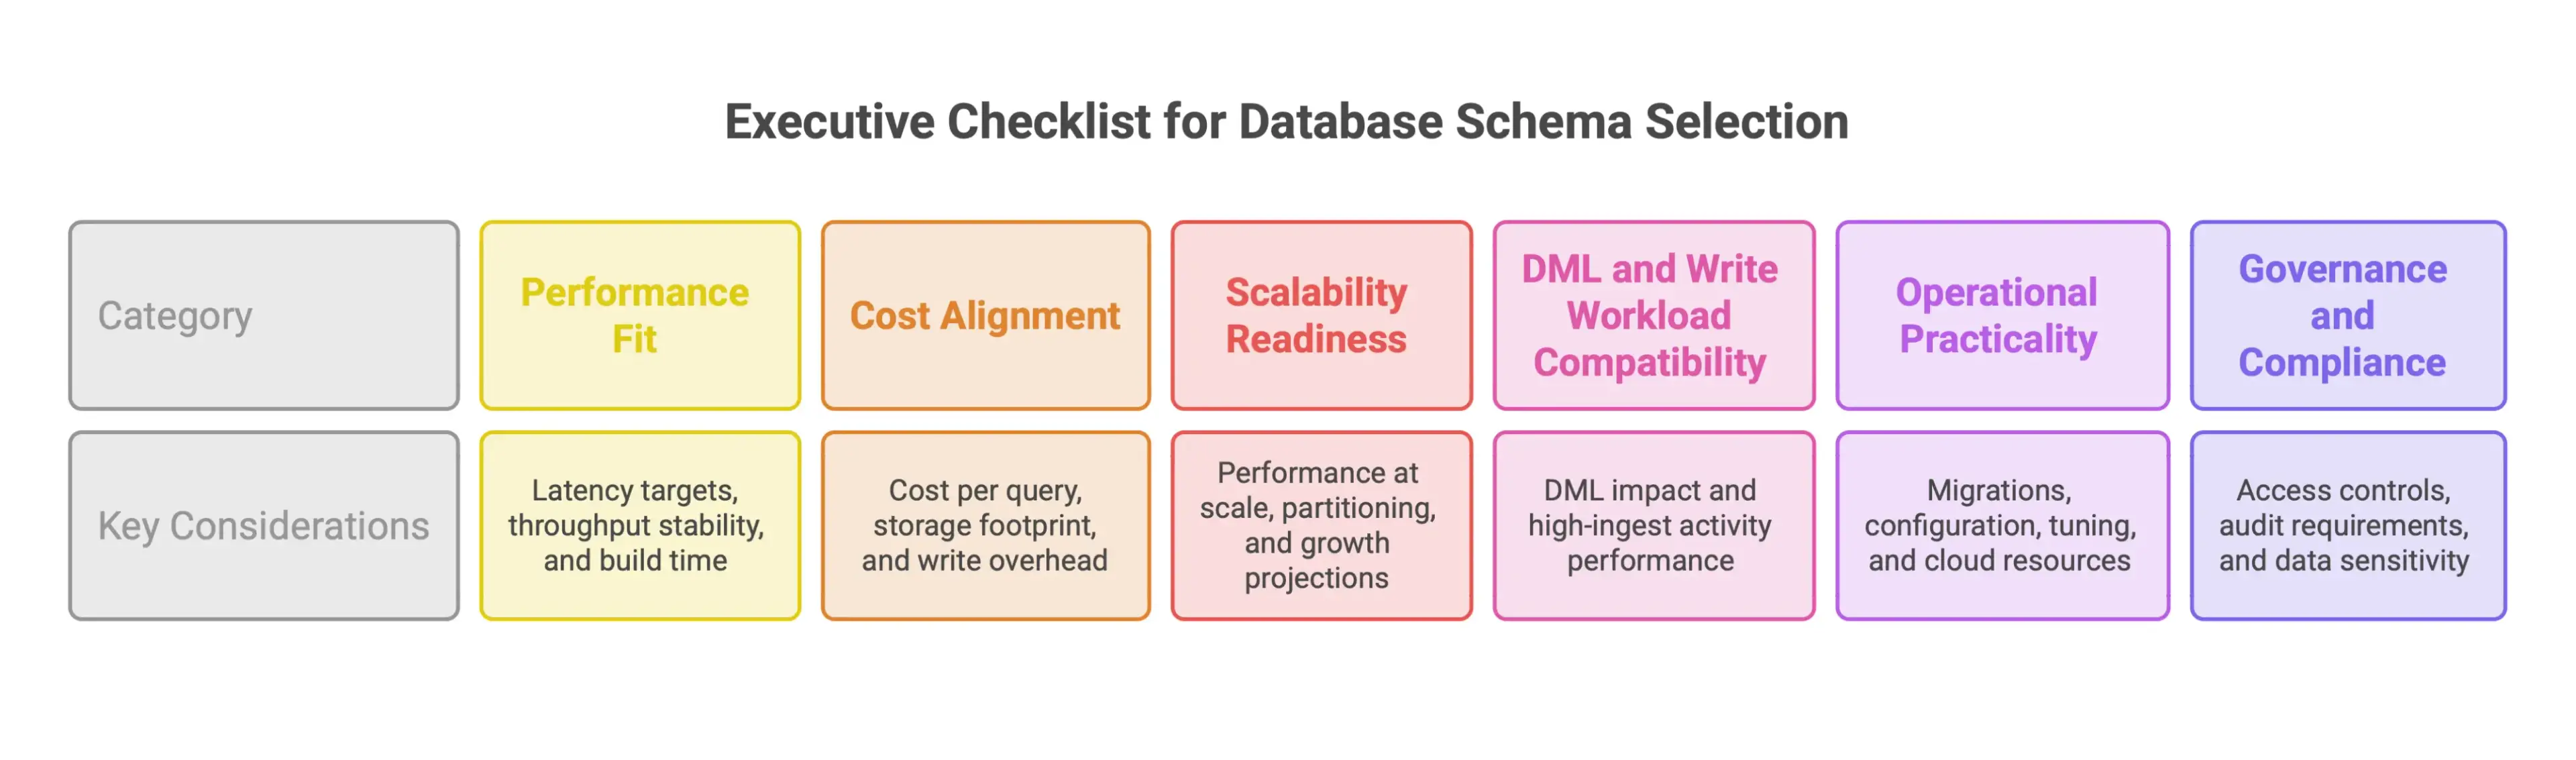
Once the benchmark is complete, the real work is deciding what the results mean for the business. The right choice has to balance performance, cost, scalability, and operational fit. This checklist helps frame that discussion for both technical teams and leadership.
Performance Fit
- Does the schema meet latency targets for its specific use cases under peak load, not just average conditions?
- Does throughput stay stable as concurrent users increase?
- Is build time acceptable for the current refresh cadence?
Cost Alignment
- What will cost per query look like at expected production volume?
- Will the storage footprint stay within budget over the next 12 to 24 months as data grows?
- Are there indexing or materialization choices that lower query cost without creating too much write overhead?
Scalability Readiness
- How does performance change as data volume grows by 2x or 10x?
- Does the schema support partitioning or sharding if horizontal scaling becomes necessary?
- Were the benchmarks run at data volumes that reflect expected growth, not just the current state?
DML and Write Workload Compatibility
- If the application depends on frequent inserts or updates, was DML impact measured directly?
- Can the schema handle high-ingest activity without degrading read performance?
Operational Practicality
- Did the benchmark include migrations, rebuilds, and concurrent workloads?
- Did the team narrow the configuration options to a reasonable amount before running benchmarks?
- Were benchmark results used to avoid manual, error prone, and time consuming tuning by identifying optimal settings?
- For the benchmarked environment, were the right cloud resources in the surrounding cloud infrastructure chosen, including the appropriate VM type and internal storage?
- Does the team have the operational experience needed to maintain this design over time?
Governance and Compliance
- Does the schema support access controls and audit requirements?
- Are there structural choices that could create compliance issues, such as denormalization that spreads sensitive data across multiple tables?
No schema will win on every front. That is normal. The goal is to understand the trade-offs clearly. If you can explain which metrics were prioritized, which ones were accepted as trade-offs, and why, you have the basis for a defensible architecture decision.
For benchmarking workflows, benchmarking software and CO₂ benchmarking are the product pages that best match this topic.
Frequently Asked Questions
What is database schema benchmarking?
Database schema benchmarking is the process of testing how a schema performs under defined workloads, datasets, and query patterns. It focuses on design choices such as table structure, relationships, indexing strategy, and data types.
Why is schema benchmarking important before production?
Schema decisions are hard to reverse once a system is live. Benchmarking helps teams validate latency, throughput, storage footprint, cost, and operational risk before the design becomes a production dependency.
Should teams benchmark OLTP and OLAP schemas differently?
Yes. OLTP workloads usually need fast row-level transactions and focused indexing, while OLAP workloads often involve large aggregations and broader reads. A schema that works well for one may perform poorly for the other. SQL databases and NoSQL systems often need different benchmarking tools and workload models, even for the same business problem.
Is a flat table always faster than a star schema?
No. Benchmark results vary by database engine, storage model, optimizer, and workload. Some cloud data warehouses perform better with star schemas, while others may favor flat tables for the same workload.
Which metrics matter most in database schema benchmarking?
Core metrics include query latency, throughput, build time, storage footprint, cost per query, and DML impact. Operational metrics such as availability, recovery time, tail latency, and throughput degradation also matter under real-world stress, even when comparing industry ready databases. Benchmark data should also support informed decisions about e commerce, big data, and other high-scale environments where availability and scalability matter.
Ready to Take the Next Step?
If you’re exploring modern cost estimation platforms, check out Nomitech’s full suite or get in touch with our team to find the right fit for your workflows.





Stay Up to Date
Subscribe to our Newsletter today and receive the latest updates, trends, expert insights, and exclusive offers tailored to your specific industry.