

EPC Benchmarking Tools: Compare Telecom, Energy, Projects
TL;DR: EPC benchmarking tools support very different needs across telecom networks, building energy performance, and engineering, procurement, and construction projects.
The right choice starts with defining the EPC domain, then matching vendors to the right KPIs, integrations, data quality requirements, and decision workflows.
EPC Benchmarking Tools: Define the Use Case Before You Compare Vendors
The tricky part of evaluating EPC benchmarking tools usually isn’t finding vendors. It’s knowing whether you’re comparing the right type of tool in the first place. A project team trying to sharpen estimates, a telecom engineer validating core network performance, and a facilities manager tracking energy ratings might all use the term EPC, but they are not solving the same problem.
That confusion can get expensive once shortlists, demos, and internal reviews start. Tighter bids, large project portfolios, fragmented cost data, compliance pressure, and multi-domain network environments all need different benchmarks. If the use case is not nailed down early, teams can end up testing the wrong KPIs and buying software that doesn’t support the decisions they actually need to make.
This guide breaks down the three main meanings of EPC benchmarking and connects each one to the right metrics, tools, and evaluation criteria. For engineering, procurement, and construction teams, it also explains where structured cost estimating tools such as CostOS can help bring benchmark data, estimates, and project controls back into a practical workflow. Start by defining which EPC problem you’re solving, then use the sections below to compare vendors with much more confidence.
Telecom EPC and 5G Core Benchmarking for Network Performance
In telecommunications, EPC stands for Evolved Packet Core, the architecture that supports LTE networks. As operators move toward standalone 5G, the focus shifts to 5G Core, or 5GC, benchmarking. In plain terms, that means testing network functions for throughput, latency, reliability, and scalability under traffic conditions that look like the real world.
The stakes are high, and they keep rising. According to Market Research Future, the global 5G Core market was valued at approximately USD 2.705 billion in 2024 and is projected to reach USD 7.339 billion by 2035, representing a compound annual growth rate of 9.5% between 2025 and 2035. That growth is being driven by demand for IoT connectivity, enhanced mobile broadband, and low-latency applications across industries, all of which put more pressure on network performance validation.
For network engineers and operators, EPC and 5GC benchmarking tools usually need to cover:
- Latency and throughput testing across network slices and user plane functions
- Scalability benchmarking under peak load conditions
- Interoperability validation between multi-vendor network components
- KPI tracking tied to service level agreements and quality of experience targets
The key question here is simple: can the tool recreate realistic traffic at scale? A synthetic test setup that misses real traffic diversity can produce results that look great in the lab, then fall apart once the network is under actual load.
Building EPC Benchmarking for Energy Ratings, Compliance, and Peer Comparison
In the built environment, EPC stands for Energy Performance Certificate. An EPC measures a building's energy efficiency on a standardised scale and is required in many jurisdictions when a property is sold, let, or constructed. Building EPC benchmarking tools go further than producing a certificate. They help asset managers, sustainability teams, and property professionals compare performance across portfolios, track assets against regulatory thresholds, and see how buildings stack up against similar properties.
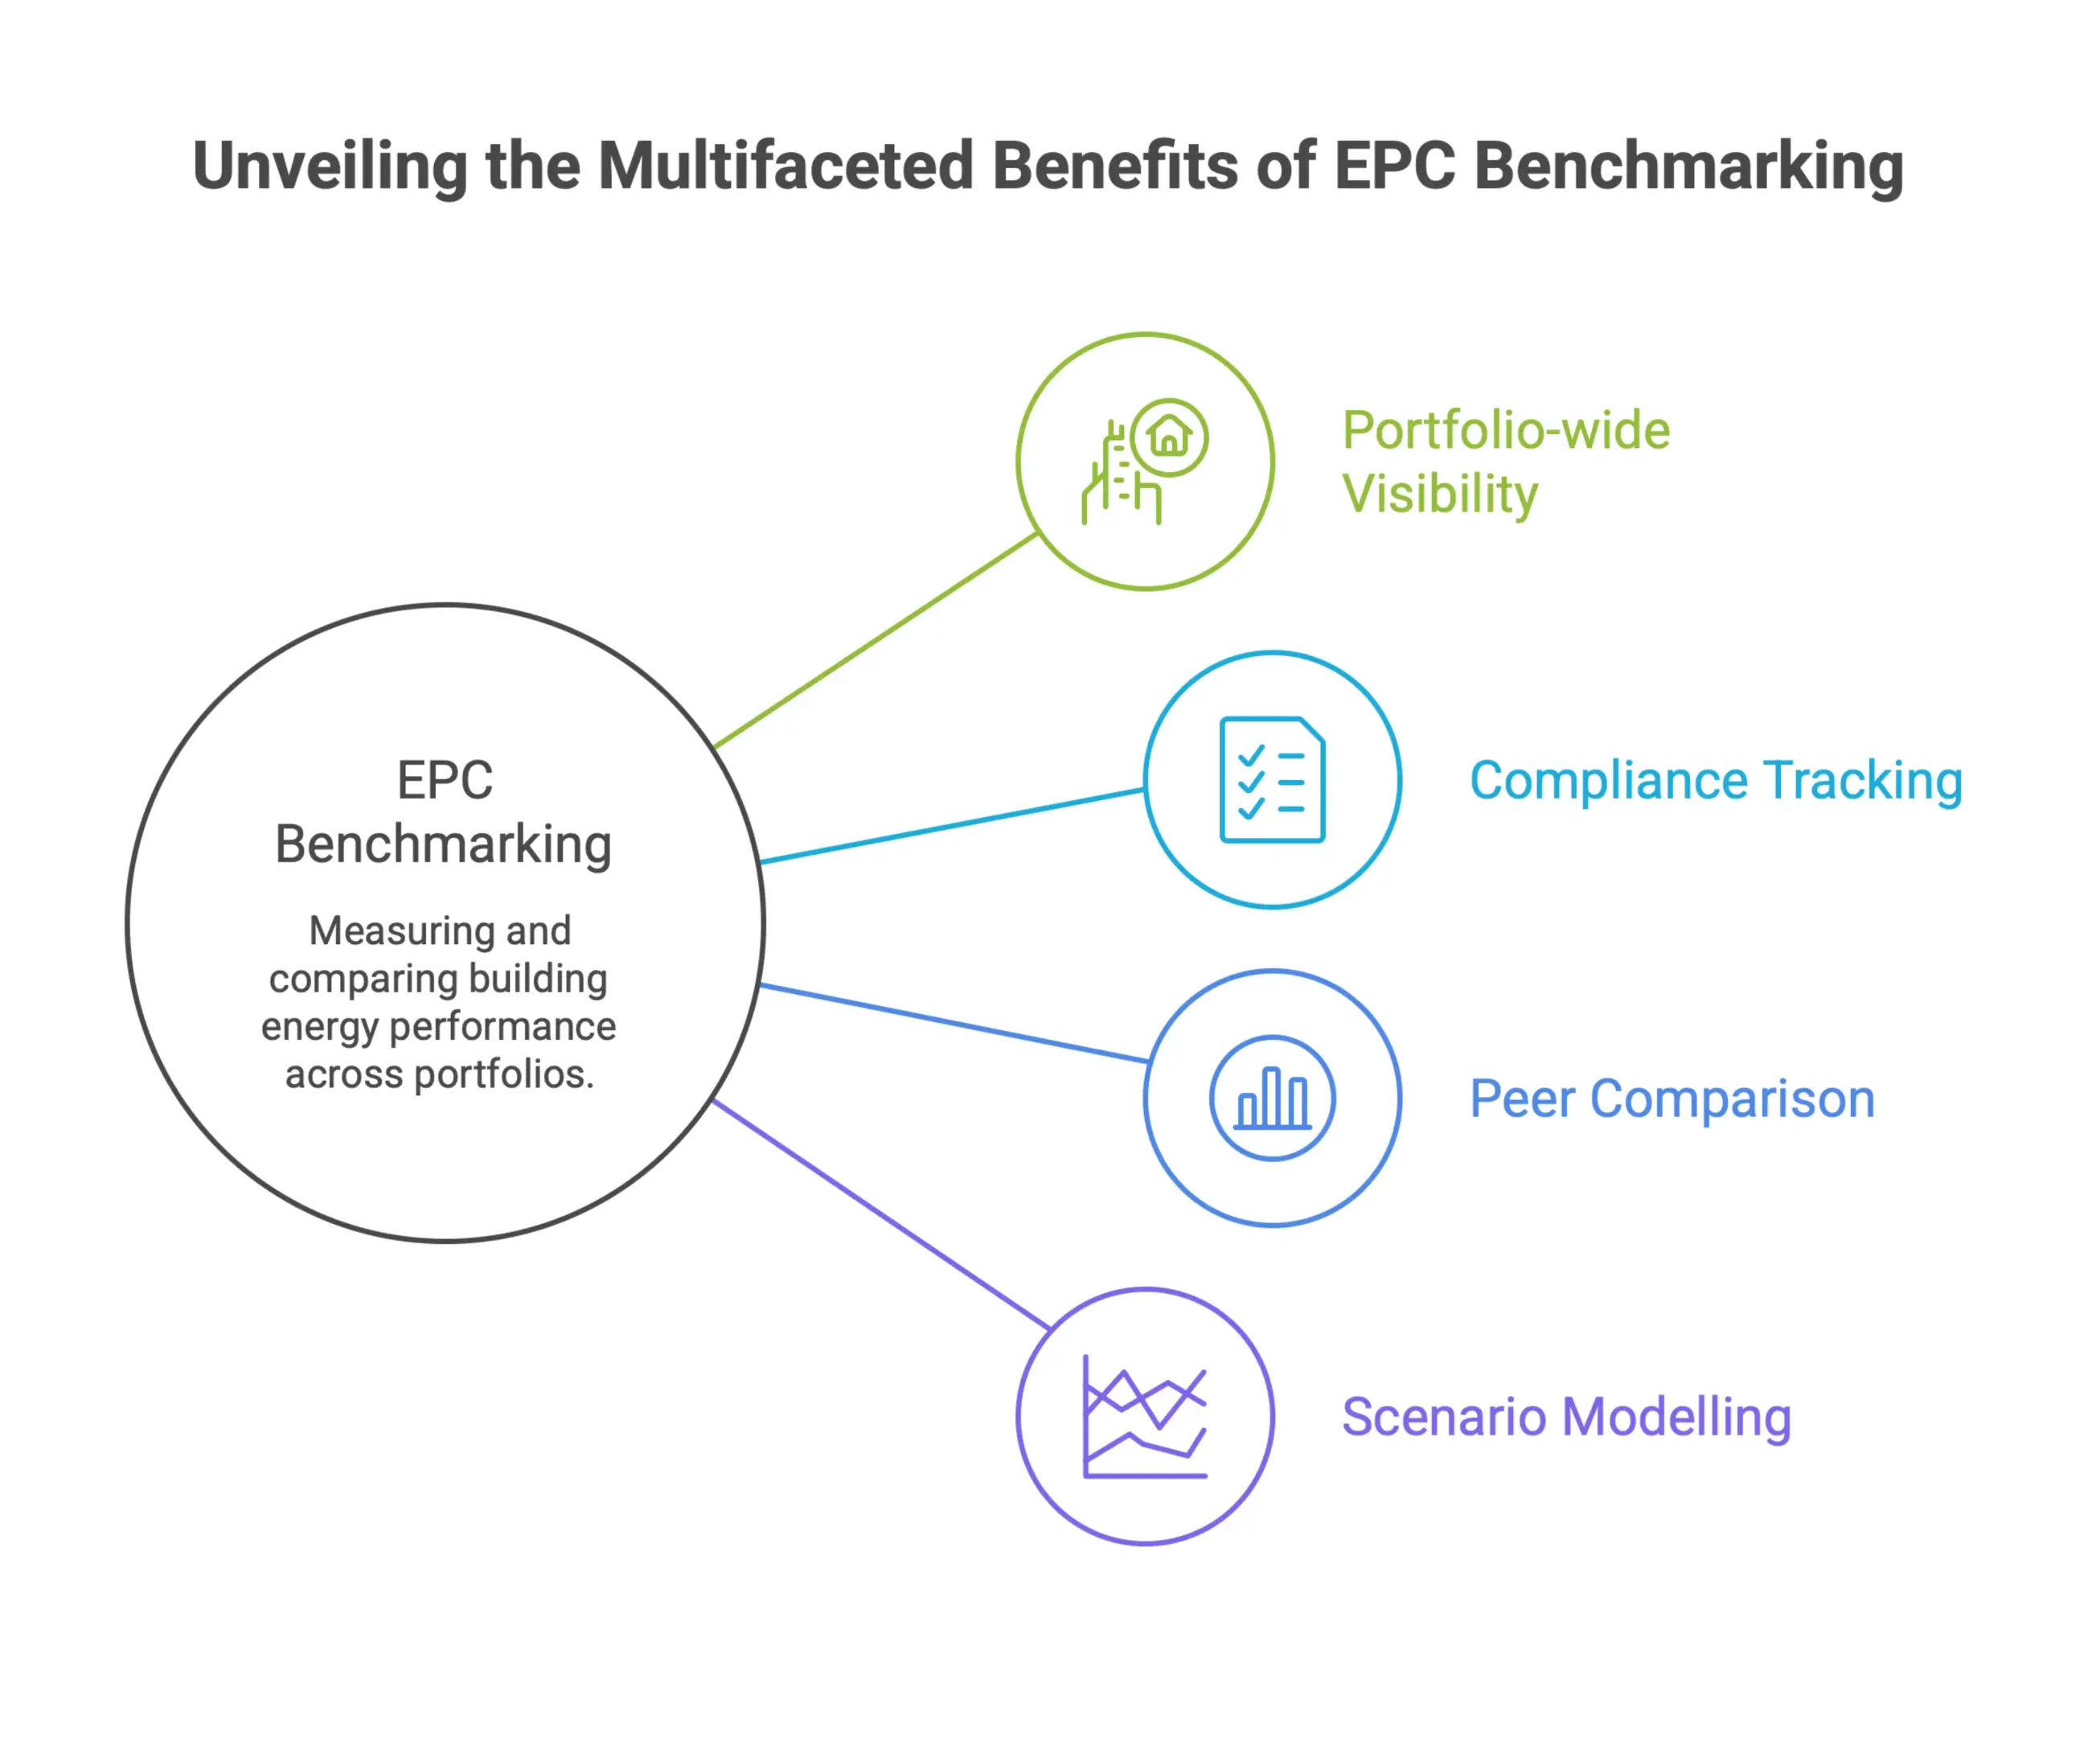
This is not the same as simply calculating an EPC rating. In this context, benchmarking means:
- Portfolio-wide visibility into energy performance across asset classes
- Compliance tracking against minimum energy efficiency standards and upcoming regulatory changes
- Peer comparison to understand how a building performs relative to similar properties in the same sector or geography
- Scenario modelling to prioritise retrofit investments based on projected rating improvements and cost per uplift
Effective energy benchmarking helps businesses lower operating costs and meet compliance, while also establishing a baseline for a building's normal energy use for future performance comparison. The most useful KPIs here are energy intensity, rating band distribution, and the gap between current performance and compliance targets. Tools that only generate static reports, without making it easy to compare assets dynamically, tend to have limited value for teams managing larger portfolios.
Anyone evaluating building EPC benchmarking tools should also look closely at data integration. How does the tool bring in existing asset data? Can it connect to energy meters, property management systems, or sustainability reporting frameworks? If every asset requires heavy manual input, the tool creates more work instead of reducing it.
Engineering, Procurement, and Construction Benchmarking for Portfolio Delivery
In engineering, procurement, and construction, EPC refers to a project delivery model where one contractor is responsible for design, procurement, and construction under a single contract. EPC benchmarking tools in this context focus on project and portfolio performance. They compare cost, schedule, productivity, and resource use across projects to identify variances, expose inefficiencies, and support better planning decisions.
This is where benchmarking gets more operationally demanding. EPC projects are often large, multi-stakeholder, and spread across different regions or sites. Useful benchmarking depends on consistent data structures across projects, normalisation for scope and location factors, and the ability to trace cost or schedule variance back to specific work packages or trades.
The KPIs that matter most in this domain include:
- Cost per unit of installed scope compared across similar project types or locations
- Schedule performance index tracked at the work package level
- Procurement cycle time benchmarked against historical baselines
- Productivity rates for key trades normalised by project complexity
Tools like those offered by Nomitech are built with this level of detail in mind, helping estimators and project controls teams create cost models that can be benchmarked consistently across a portfolio instead of treated as one-off documents.
When selecting EPC project benchmarking tools, focus on data standardisation, integration with existing project controls systems, and whether the benchmarks lead to action, not just reporting. Finding a variance is useful. Understanding why it happened, and what to do next, is where the real value shows up.
Getting clear on which EPC you are benchmarking is not a small detail. It determines which KPIs matter, what integrations you need, which vendors are worth your time, and whether the tool you choose will deliver measurable value or simply add another layer to your reporting stack.
Core Metrics to Benchmark: Performance, Cost, Compliance, and Business Outcomes
Good EPC benchmarking goes well beyond checking whether the network is online. For executives and engineering leaders, the metrics that matter cut across technical performance, commercial efficiency, and operational responsiveness. Getting that balance right is what separates teams that are simply keeping things running from those using benchmark data to create real business value.
The breakdown below covers the KPI categories that should sit at the center of any serious EPC benchmarking program.
Technical KPIs: Throughput, Latency, Signaling Load, Stability, and Scalability
Technical metrics are the natural starting point for EPC benchmarking. They show how the core network performs under real conditions and where capacity or reliability issues may begin to appear.
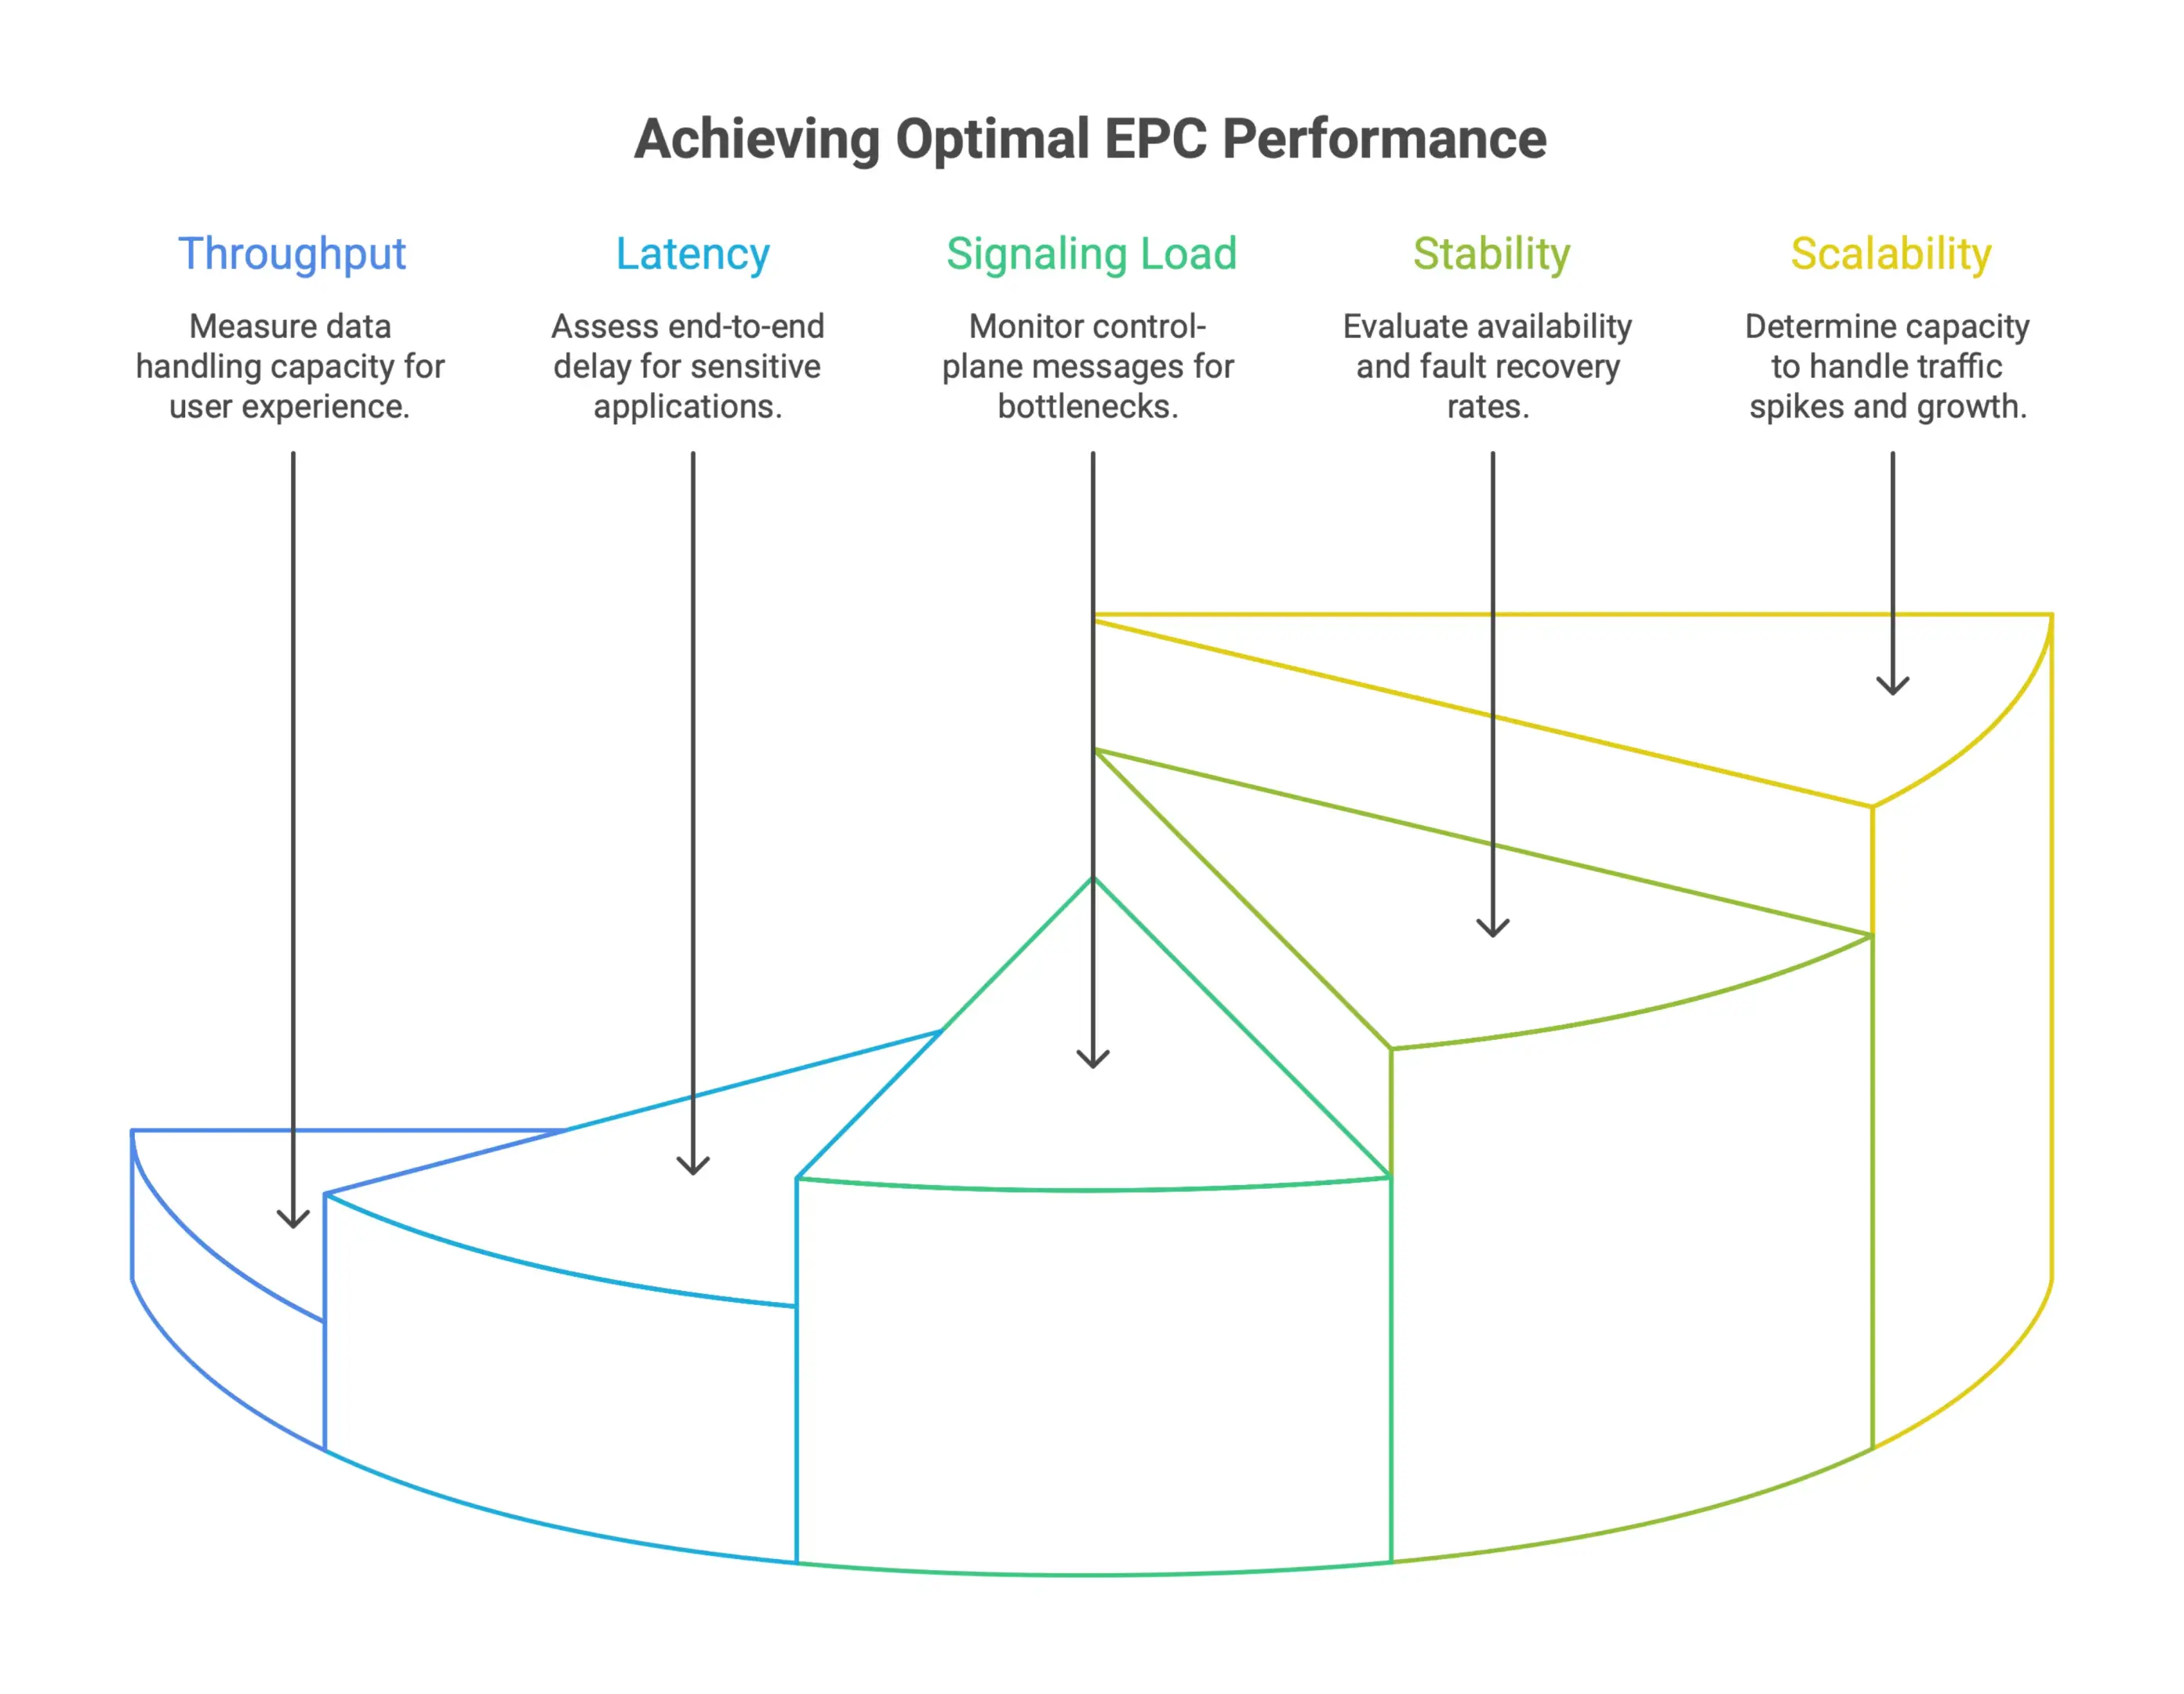
Key technical KPIs to track include:
- Throughput: The amount of data the EPC can handle in a given period, which has a direct impact on user experience and how efficiently the network is being used.
- Latency: End-to-end delay across the core. This becomes especially important as operators support more latency-sensitive applications and services.
- Signaling load: The volume of control-plane messages the network processes. It is easy to overlook, but it often exposes bottlenecks as subscriber counts and device density rise.
- Stability: Usually measured through availability and fault recovery rates, stability shows how well the network holds up during peak traffic or infrastructure changes.
- Scalability: How effectively the EPC architecture can absorb traffic spikes and support growth without performance slipping or costs rising too fast.
These are baseline metrics for any benchmarking effort. They become much more useful, though, when you view them alongside commercial and operational data.
Commercial KPIs: Opex, Capex, Cost-to-Serve, and Peer Positioning
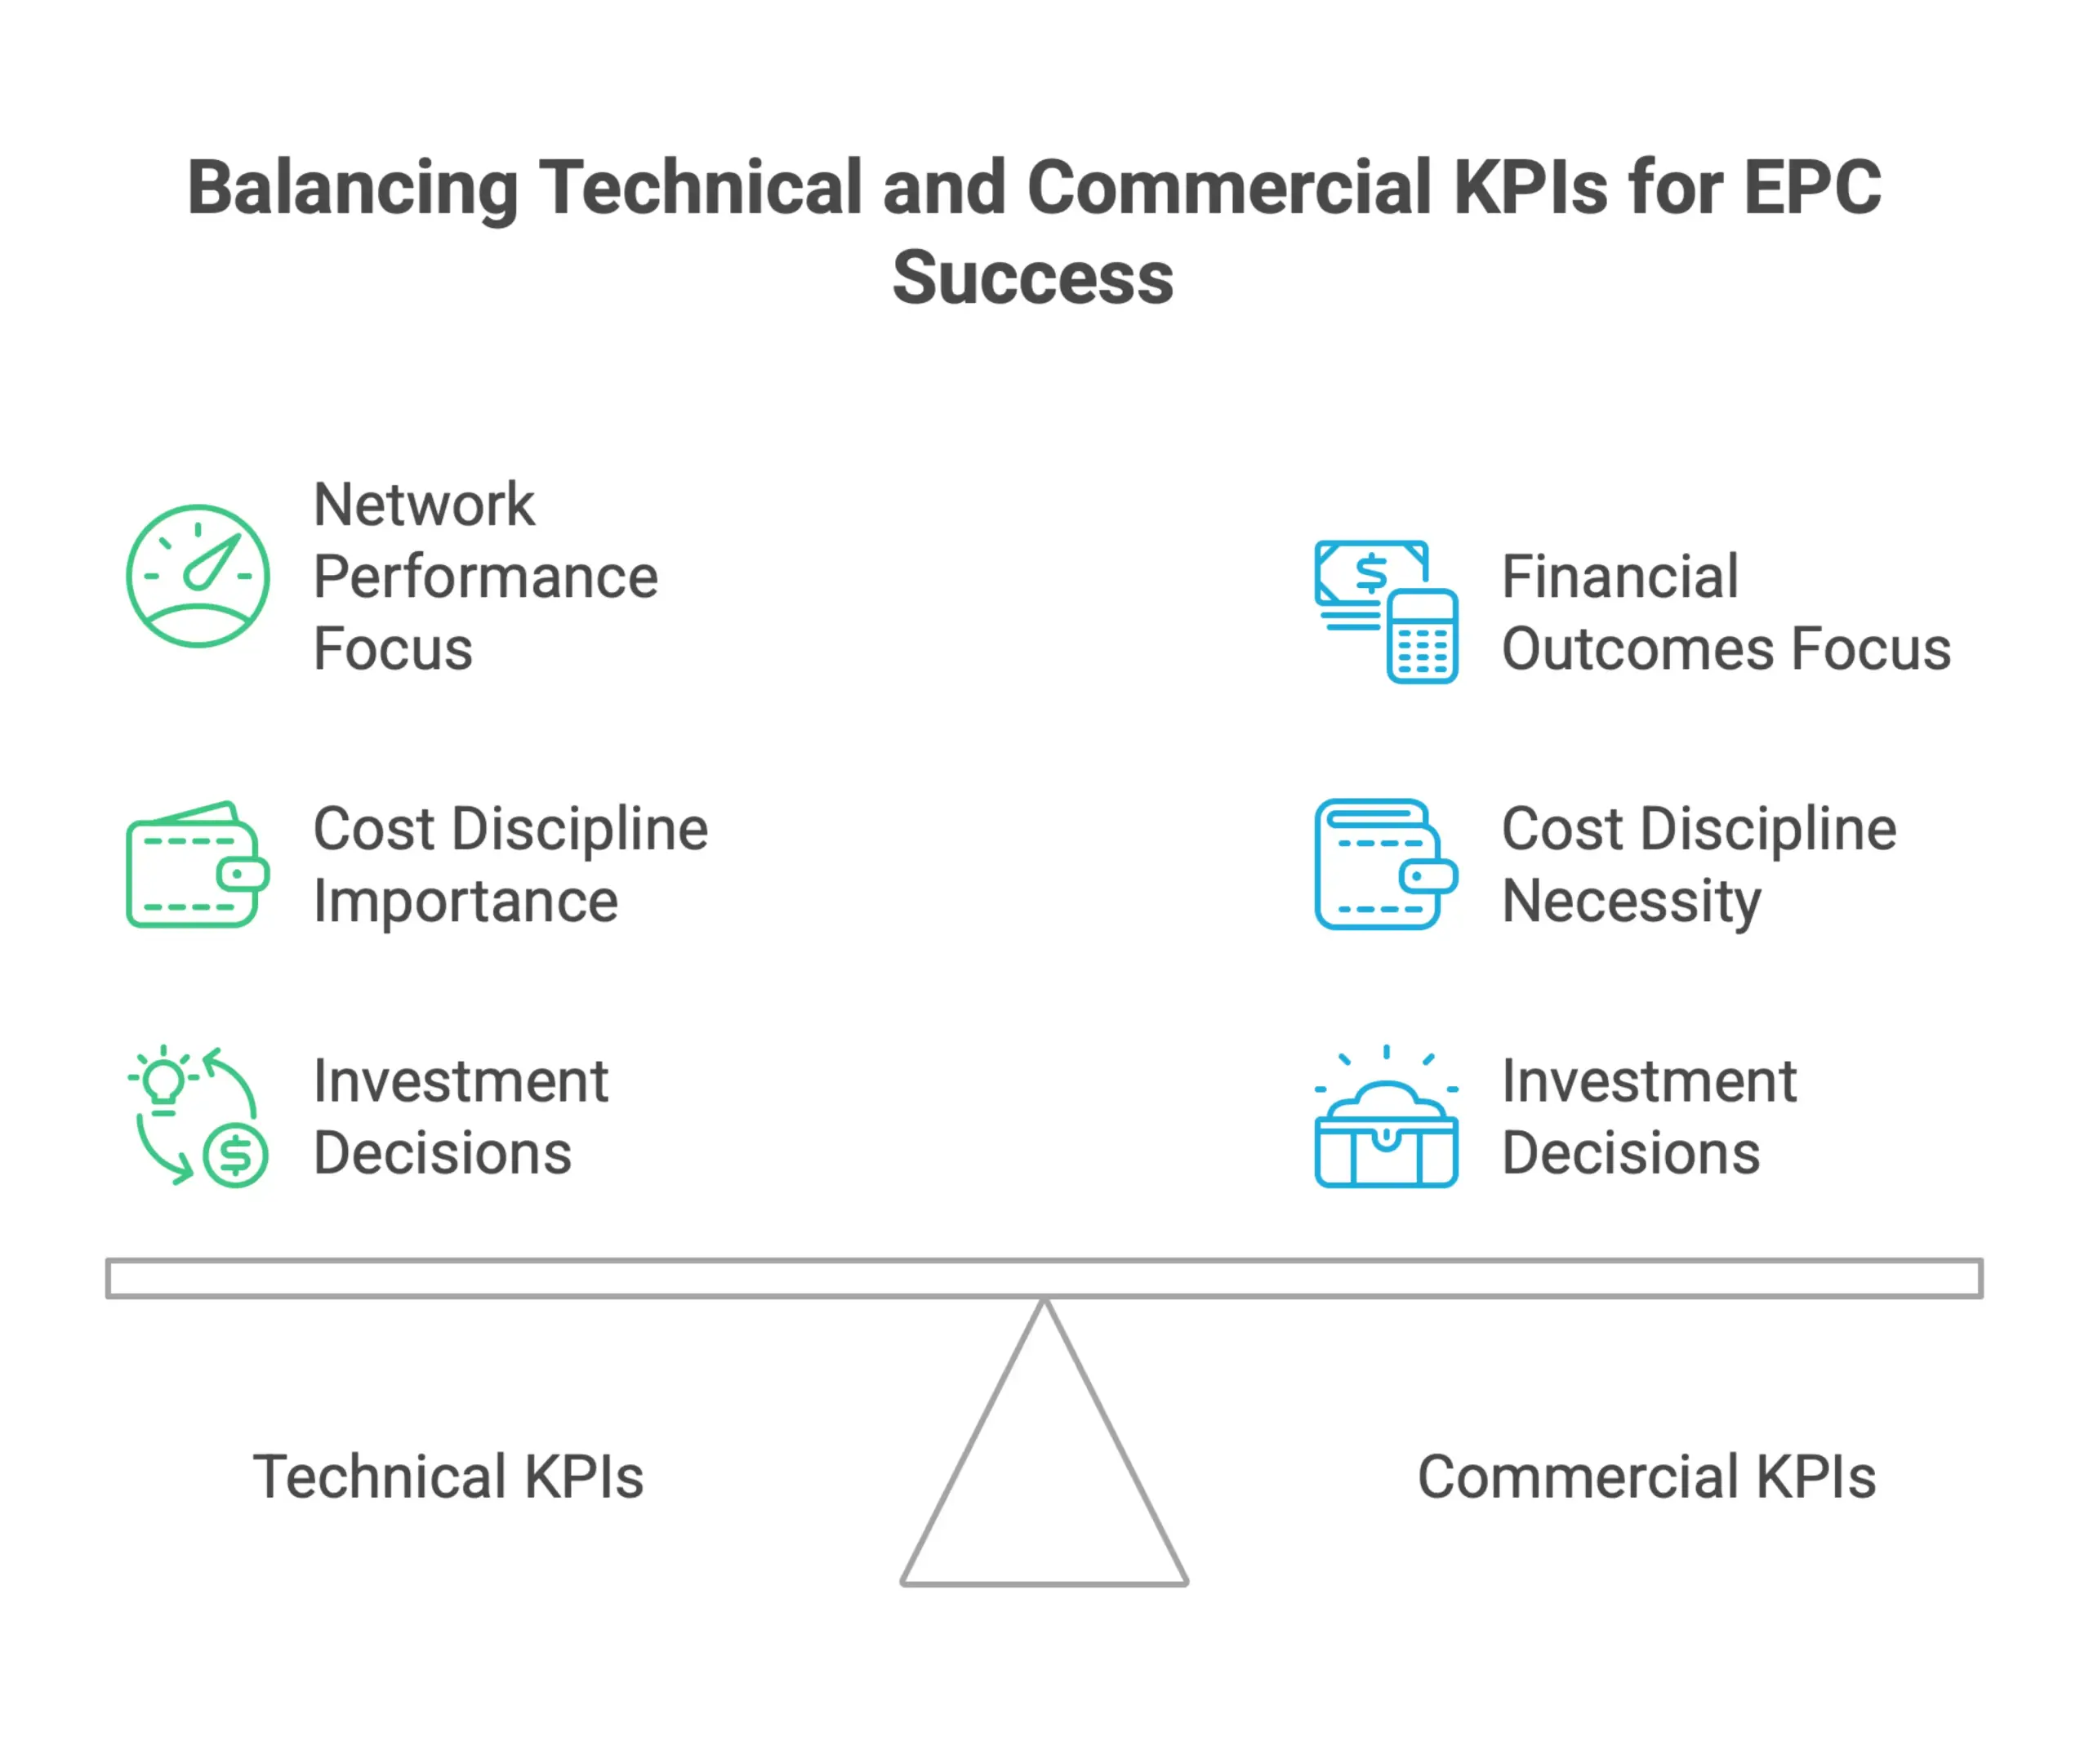
Technical performance matters, but without cost discipline it is hard to defend at the executive level. Commercial KPIs connect network performance to financial outcomes and help leadership make better calls on where to invest.
According to Nokia, survey data shows that operational expenditure remains one of the most important KPIs respondents expect to stay critical for telecom success, with capital expenditure close behind. That is a clear reminder that cost metrics deserve the same attention as technical ones.
The commercial metrics worth benchmarking include:
- Operational expenditure (Opex): The ongoing cost of running and maintaining the EPC environment, including staffing, licensing, and infrastructure management.
- Capital expenditure (Capex): How efficiently investment translates into network capacity and service capability.
- Cost-to-serve: The fully loaded cost of delivering a unit of service or supporting a subscriber. This becomes especially useful when comparing your economics against peers.
- Peer positioning: Comparing your cost structure and delivery economics with similar operators to see where you may be overspending or underinvesting.
Nokia also points out that relying only on traditional network metrics can slow operators down as they move toward more technology-driven business models. Bringing cost-to-serve and efficiency benchmarks into the EPC evaluation framework is a practical way to keep that shift grounded in real numbers.
Operational KPIs: Time-to-Market, Service Agility, and Customer Experience
Operational KPIs connect what the network does technically with what the business actually delivers. They matter more every year as operators compete on speed, flexibility, and service quality, not just infrastructure footprint.
Nokia's research places customer satisfaction and time-to-market for new services among the top KPIs expected to define success going forward. That lines up with what many operators are already seeing. The network is no longer just a delivery layer. It is part of the competitive edge.
Operational KPIs to include in your benchmarking framework:
- Time-to-market: How fast the team can launch new services or respond to shifts in demand. This is a direct measure of organizational and infrastructure agility.
- Service agility: The ability to configure, test, and roll out new offerings without long lead times or heavy manual effort.
- Customer experience: Measured through service availability, session quality, and issue response. This links network performance directly to subscriber satisfaction and retention.
Taken together, these operational indicators show whether the EPC environment is helping the business move faster or slowing it down. When you benchmark them consistently, it becomes much easier to identify opportunities where process improvements and technology investments will deliver the strongest return.
Telecom EPC Benchmarking Tools for LTE, IMS, VoLTE, and 5G Core Testing
Before any mobile core network goes live, operators, vendors, and test labs need to know it can handle real signaling loads, subscriber volumes, and multi-interface complexity. EPC benchmarking tools make that validation possible by emulating network functions, generating controlled traffic, and surfacing performance gaps in a safe pre-production environment.
This section covers three practical benchmarking platforms available today, organized by the network environments and interfaces they are designed to test.
Virtual Core Network Emulation Across 3G, EPC, 5GC, IMS, and VoLTE
One of the hardest parts of telecom testing is benchmarking across multiple network generations in one environment. Not every operator is working in a clean 5G-only setup. In many cases, 3G, LTE, and 5G are running at the same time, with IMS and VoLTE layered in as well. Test environments need to reflect that reality.
IPnetfusion's dsTest is built for this kind of multi-generation validation. It can emulate 3G Core, EPC, 5G Core, IMS, and VoLTE nodes in a virtual environment, so teams can run functional and performance tests against telecom cores without deploying physical hardware for every simulated element.
In practice, that gives test engineers far more flexibility. Instead of building separate rigs for each network generation, dsTest simulates the required core network elements and communicates directly with the system under test. That makes it possible to benchmark signaling behavior, capacity, and stability across legacy and next-generation environments from one tool.
Key testing capabilities enabled by this approach include:
- Functional validation of core network signaling across multiple generations
- Performance benchmarking for capacity and stability assessment
- VoLTE and IMS node emulation alongside EPC and 5GC functions
For labs and operators managing hybrid networks, this kind of virtual emulation cuts test cycle time and reduces the infrastructure burden that usually comes with physical test setups.
LTE S1 and X2 Interface Load Testing for RAN and EPC Readiness
The S1 and X2 interfaces are two of the most important connection points in an LTE network. S1 links the eNodeB to the EPC, while X2 handles communication between eNodeBs. If these interfaces are not validated under realistic load before rollout, it is hard to know whether the RAN and core are truly ready for production.
EXFO's EPC-SIM is designed for this exact job. It acts as a flexible load-testing tool that can simulate EPC, IMS, and eNB entities at the same time in a single unit. That means test teams can generate functional load across both radio and core interfaces from one system, instead of piecing together separate simulators for each element.
By focusing directly on the S1 and X2 interfaces, EPC-SIM supports structured benchmarking of:
- LTE RAN performance under controlled traffic conditions
- EPC capacity and throughput thresholds
- Network robustness ahead of live deployment
For labs with limited hardware, consolidating EPC, IMS, and eNB simulation into one unit is a real advantage. It also simplifies setup and reduces the number of moving parts that can throw off a benchmarking run.
For operators running pre-deployment readiness checks, this kind of interface-level load testing gives a clearer baseline for both RAN and core performance. That is much more useful than broad traffic generation with no visibility into where the bottleneck is actually happening.
5G Core Network Emulation for 3GPP Compliance and Multi-Function Scalability
Testing a 5G Core is not just about pushing traffic through the system. It means emulating the network functions, interfaces, and signaling flows defined by 3GPP standards, then doing it at a scale that reflects real deployment conditions.
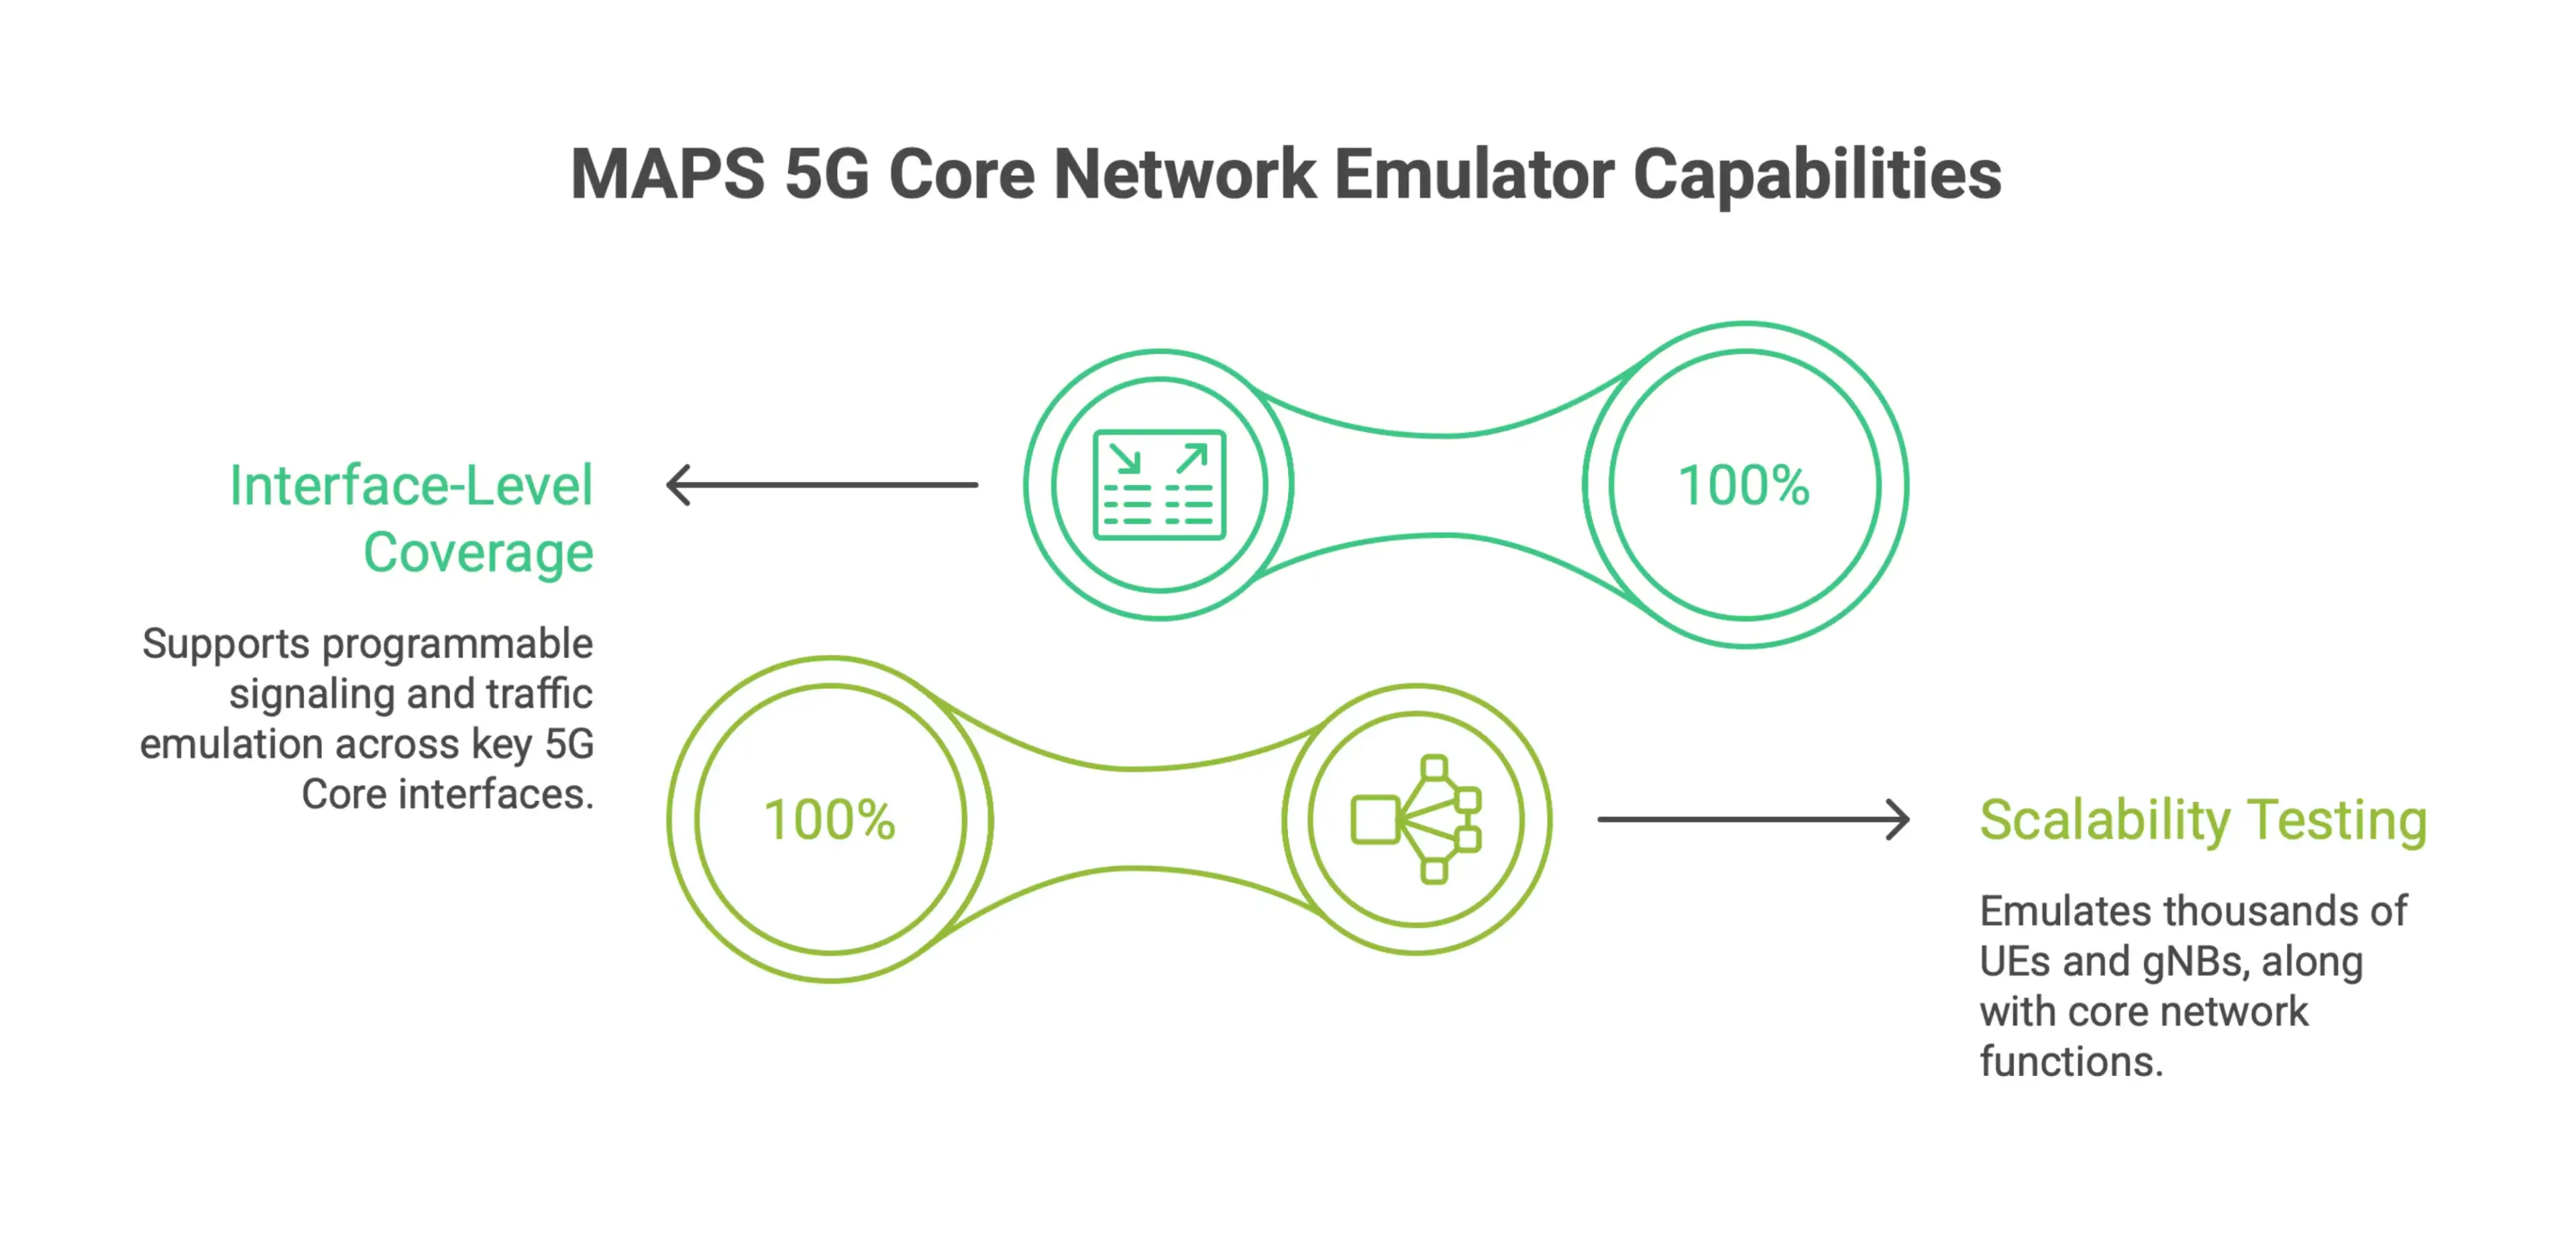
GL Communications' MAPS 5G Core Network Emulator is built around that need. The platform supports programmable signaling and traffic emulation across key 5G Core interfaces, including N1/N2, N4, and multiple control-plane and user-plane links. That interface-level coverage lets teams validate the signaling behavior of individual network functions on their own or as part of a full core architecture.
Where MAPS becomes especially useful is scalability testing. It can emulate thousands of UEs and gNBs at once, along with core network functions such as AMF, SMF, UPF, AUSF, and UDM. That makes it possible to benchmark:
- 5G Core performance under high subscriber load
- Scalability of individual and combined network functions
- Compliance with 3GPP standards across control and user plane interfaces
For vendors working toward network function certification, or operators validating a 5G Core before launch, that level of functional emulation creates a much more realistic test environment than basic connectivity checks ever could.
Compliance benchmarking is where this approach really pays off. Instead of discovering 3GPP conformance issues late in live integration, teams can catch them earlier in the development cycle, when they are easier and cheaper to fix.
Benchmarking High-Throughput EPC and 5G Core Infrastructure
Evaluating EPC and 5G core infrastructure is about more than scanning a spec sheet. For the people making network planning and deployment decisions, the real job is understanding what benchmark numbers actually tell you, and where they stop being useful. This section looks at how to read published performance data, spot the gap between lab results and live deployments, and weigh the tradeoffs between hardware acceleration, virtualization, and cloud-native architectures.
Using Published Throughput Benchmarks as Reference Points
Published throughput benchmarks are a useful starting point when you are comparing systems, but they only make sense when you read them in context.
One good reference is Affirmed Networks, which reported a virtualized 5G core solution reaching 100 Gbps per CPU socket, and 200 Gbps on a dual-socket server. That performance came from Intel Xeon Scalable processors paired with a 100 GbE NIC, and the gains were tied to software efficiency improvements and cache optimization, not just more powerful hardware.
That distinction matters. When a benchmark quotes throughput, the number depends heavily on:
- The processor architecture in use
- The NIC specifications and how traffic was injected
- Whether any acceleration technology was involved
- The workload profile being tested
Used properly, these figures help you pressure-test vendor claims and see whether two solutions are really being compared under the same conditions. They also help project managers and project controls teams judge whether a tool or platform can support the project outcomes required in real deployment.
Separating Lab Benchmarks from Production-Ready Performance
Lab benchmarks are built around controlled, optimized conditions. Production environments are not.
In a test lab, engineers can tune CPU affinity, isolate traffic flows, remove background noise, and configure the hardware to chase peak numbers. In a live network, you are dealing with mixed traffic, shifting load patterns, software upgrades, and shared compute resources. That creates performance variation that lab tests simply are not designed to capture.
When you review vendor benchmark material, look for signs that the result reflects something closer to production reality:
- Is the benchmark run on commercial off-the-shelf hardware, or on a purpose-built test rig?
- Does the test reflect realistic traffic profiles, or synthetic packet streams?
- Is the result per-socket, per-node, or aggregated across a cluster?
- Are acceleration technologies clearly identified and separated from baseline software performance?
The Affirmed Networks white paper is useful because it is explicit about where the result comes from. It attributes performance to software efficiency, cache optimization, and Intel Stratix FPGA acceleration. That kind of clarity is a good sign. If a benchmark does not separate those pieces, it becomes much harder to tell how the system will behave when one of them changes or is removed.
The difference between peak lab throughput and sustainable production throughput is real. Before using any vendor number as a planning baseline, ask exactly how it was measured and under what conditions.
Evaluating Hardware Acceleration, Virtualization, and Cloud-Native Core Tradeoffs
Choosing the right infrastructure model for an EPC or 5G core deployment means working through real performance and operational tradeoffs. There is no one-size-fits-all answer here, and benchmark data should inform the decision, not make it for you.
Hardware Acceleration
Acceleration technologies like FPGAs can improve packet processing by offloading specific tasks from general-purpose CPUs. In the Affirmed Networks example, Intel Stratix FPGA acceleration was one of the contributors to the 100 Gbps per socket result. That kind of uplift is valuable, but it comes with practical tradeoffs around vendor lock-in, hardware life cycle management, and the added complexity of supporting specialized silicon alongside standard compute infrastructure.
Virtualization
Virtualized network functions let operators run core network components on standard server hardware, which improves flexibility and makes better use of available resources. The Affirmed Networks benchmark was run on a virtualized platform, showing that strong throughput is possible in a virtualized environment when the software is well tuned and the hardware is properly sized.
Cloud-Native Deployment
Cloud-native architectures bring containerization, microservices, and orchestration into the mix, which supports scaling and resilience. The tradeoff is that each extra abstraction layer can add some overhead. When you evaluate cloud-native core solutions, the benchmark should reflect the containerized runtime, not a bare-metal test or an old VM baseline.
Key questions to ask when comparing these models:
- Does the benchmark reflect the deployment model you actually plan to use?
- How does performance scale as you add nodes or increase load?
- What does it cost to maintain acceleration hardware versus scaling cloud-native workloads?
- Is the reported throughput measured at the application layer or at the NIC level?
Knowing what is actually being measured, and under which architecture, is what separates a useful benchmark from a marketing claim. It also helps organizations identify opportunities to improve performance before the system is locked into a final deployment model.
End-to-End Network Benchmarking Across Domains and Peers
Isolated lab testing still matters, but it only tells part of the story. If you want a real read on how an EPC environment is performing, you need to look at live network paths, compare results with industry peers, and spot cost inefficiencies before they start eating into margins. This section looks at how end-to-end benchmarking frameworks help teams do exactly that.
Multi-Domain Performance Measurement for End-to-End Service Assurance
One of the biggest challenges in EPC benchmarking is simple. Network paths rarely stay inside one administrative domain. Traffic moves across multiple segments, often owned by different teams or organizations, which makes it hard to see where performance starts to slip.
The GÉANT Performance Measurement Platform tackles that problem head-on. It is built as a multi-domain network monitoring and management service, with coordinated performance measurements across NREN and GÉANT networks. Because it can track performance across administrative boundaries, it gives operators a practical way to benchmark end-to-end behavior, including paths that cross EPC and core segments.
For teams managing distributed, complex architectures, that kind of visibility is not optional. Instead of relying on isolated snapshots, they can build a continuous view of service performance that reflects how the network actually behaves in production.
Key capabilities to look for in multi-domain measurement include:
- Coordinated testing across administrative boundaries
- Consistent KPI definitions across all measured segments
- The ability to correlate performance data from EPC and transport layers at the same time
Peer Benchmarking for Network Quality, Efficiency, and Customer Experience
Knowing your own numbers is useful. Knowing how those numbers stack up against the industry is what turns data into action.
Accenture describes its telecommunications benchmarking service as an industry-standard network assessment that compares operators' performance and cost metrics directly with peers. The approach is designed to expose performance gaps and guide improvements in network quality, operational efficiency, and customer experience. Just as important, it applies this comparison model to EPC and core network KPIs, so operators can see where they really stand in the market.
That comparison matters because internal benchmarks can be misleading. A team may be improving quarter after quarter and still be falling behind the industry. Peer benchmarking closes that gap and gives leadership a more realistic view of performance.
For leadership teams, this translates into:
- A stronger basis for capital investment decisions
- Clear evidence of where operational improvements are needed
- A way to set performance targets that are realistic and market-informed
Cost Benchmarking to Identify Network and Core Operations Efficiency Gaps
Performance gaps are one part of the picture. Cost gaps are the other, and they are often harder to see without outside reference points.
Kearney offers its ACT survey as a way for telecommunications providers to assess cost benchmarks and compare their cost performance with global peers across major expense categories. The tool is designed to give operators immediate insight into cost positioning and efficiency, helping them spot where network and core operations costs, including those tied to EPC infrastructure, may be drifting away from industry norms.
The real value is speed and clarity. Instead of waiting on a long consulting engagement to understand where costs are out of line, operators can use a structured survey to identify the biggest gaps quickly and focus on the areas that matter most. That same logic supports operational research and internal benchmarking programs in EPC projects, where teams need benchmark data they can trust.
Practical areas where cost benchmarking drives impact in EPC contexts include:
- Identifying over-investment in legacy core infrastructure relative to peers
- Spotting areas where operational costs are higher than the industry average without a matching quality gain
- Supporting business cases for network modernization or vendor consolidation
Taken together, multi-domain performance measurement, peer quality benchmarking, and cost benchmarking give operators a much fuller picture. Each layer adds context the others cannot provide on their own, and that combination makes it easier to make informed, defensible decisions about EPC environments.
Energy EPC Benchmarking Tools for Buildings and Regulatory Reporting
For real estate owners, public agencies, and sustainability teams, energy performance certificates are more than a compliance checkbox. Used well, EPC data becomes a practical tool for tracking building performance, meeting reporting requirements, and supporting long-term decarbonization plans. This section looks at what effective EPC benchmarking means in day-to-day use, and what matters most when you're evaluating tools for a portfolio.
Standardized Energy Benchmarking and National Peer Comparison
One of the most useful features of a purpose-built EPC benchmarking tool is its ability to measure building performance against a consistent, standardized scale. Without that shared baseline, comparing two buildings across different locations, ages, or use types quickly becomes messy and hard to act on.
In the United States, ENERGY STAR Portfolio Manager, developed by the U.S. EPA, is widely recognized as the industry standard for this kind of benchmarking. It gives owners and managers a way to compare energy use across assets and see how those buildings stack up against similar properties nationwide. That peer comparison matters because raw energy numbers only tell part of the story. Knowing a building uses a certain amount of kilowatt hours each year is useful. Knowing how that performance compares to similar buildings is what helps teams make better decisions.
This combination of standardized scoring and national peer data also sits behind many local and regional benchmarking laws. Regulatory frameworks increasingly expect building owners to submit performance data in recognized formats, and tools that follow that structure make compliance far less painful.
For EPC tools to do this well in other markets, they need to provide:
- A consistent scoring methodology across asset types
- Peer comparison at a meaningful scale, whether regional, national, or sector-specific
- Output formats that match reporting requirements in the relevant jurisdiction
What Building Owners Should Look for in EPC Benchmarking Software
Choosing the right EPC benchmarking software is less about ticking off features and more about whether it fits the way teams actually work. A tool can look strong on paper and still fall short if it is hard to use consistently across a portfolio.
Based on the model established by ENERGY STAR Portfolio Manager, a few qualities tend to separate effective benchmarking tools from generic energy management software.
Standardized and reproducible scoring
The software should apply the same methodology every time so scores stay comparable across assets and over time. If the calculations drift or rely on manual adjustments, benchmarking loses much of its value.
Peer comparison at scale
Comparable building data is what turns a score into something useful. A tool that only shows absolute energy use, without context, makes it harder to decide where improvements will have the biggest impact.
Regulatory reporting alignment
Many jurisdictions now require formal energy benchmarking submissions. Software that structures data in compliance-ready formats can cut a lot of admin work, especially for owners managing large or spread-out portfolios.
Portfolio-level visibility
A single building score is useful, but portfolio-wide reporting is where the bigger decisions happen. The ability to flag underperforming assets, track progress over time, and direct resources where they matter most is essential for serious EPC management.
Audit-ready records
For public agencies and organizations that face third-party verification, accurate and timestamped performance records are a must. Clean data trails make accountability easier at every step.
Connecting Energy Performance Certificates to ESG and Decarbonization Reporting
EPC data does not sit in a silo. In most organizations, building energy performance is now a core input for ESG disclosures, net zero commitments, decarbonization roadmaps, and sustainability performance reporting. The problem is that EPC data often lives in one system, while ESG reporting happens somewhere else entirely.
Closing that gap takes benchmarking tools that are built for more than compliance. They need to support integration. Platforms based on the model established by ENERGY STAR Portfolio Manager show how standardized scoring and peer comparison data can feed into regulatory reporting, giving sustainability teams a framework they can actually build on.
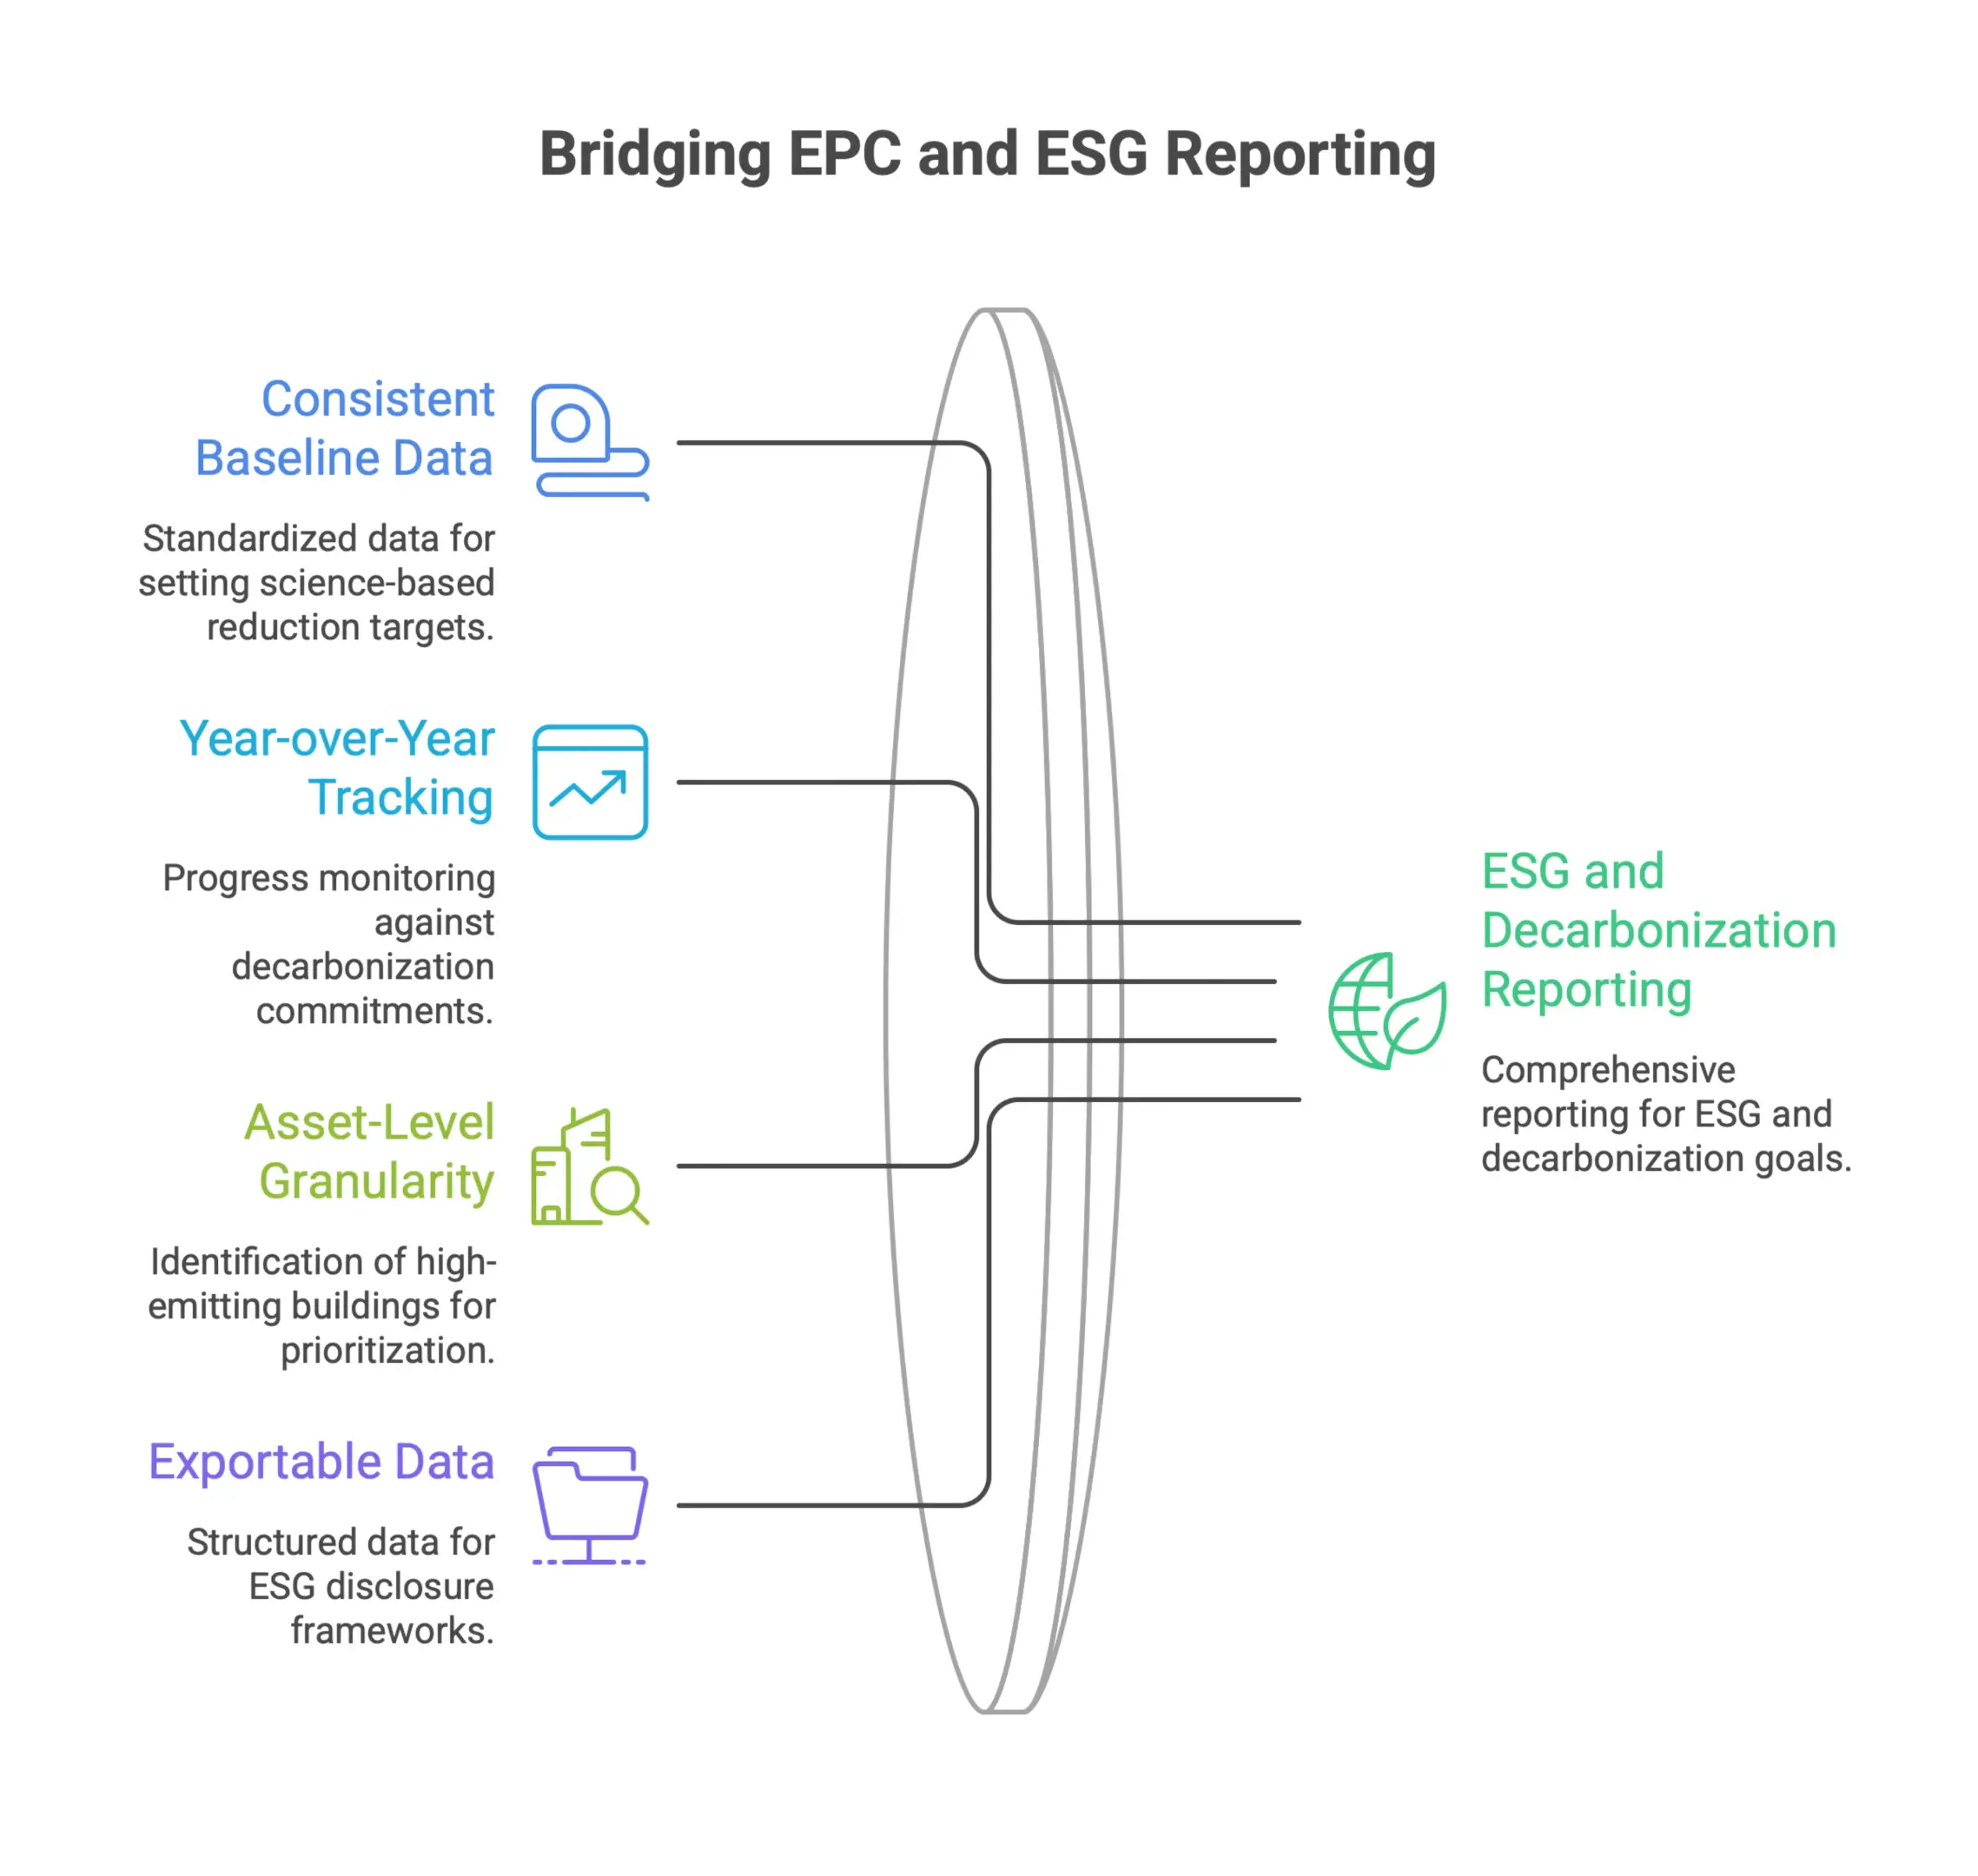
For ESG and decarbonization reporting, EPC benchmarking tools should support:
- Consistent baseline data that can be used to set science-based or policy-aligned reduction targets
- Year-over-year performance tracking to show real progress against decarbonization commitments
- Asset-level granularity so high-emitting buildings in a portfolio can be identified and prioritized
- Exportable, structured data that fits into broader ESG disclosure frameworks and reporting platforms
As pressure on building performance continues to grow, the organizations that stay ahead are the ones treating EPC benchmarking as an ongoing data process, not a one-time compliance task. Tools built for that job, with standardized scoring, peer benchmarking, and compliance-ready outputs, make that approach far easier to manage.
EPC Project Benchmarking Tools for Engineering, Procurement, and Construction Portfolios
Across capital-intensive industries, the ability to compare project performance consistently and objectively is what separates disciplined portfolio management from reactive decision-making. EPC project benchmarking tools give project owners, contractors, and PMOs a structured way to measure cost, schedule, procurement, productivity, and delivery outcomes, both across projects running in parallel and against completed historical work. When that data is centralized and searchable, it becomes one of the most useful inputs a project controls team can have.
Benchmarking Active and Historical Project Performance
One of the biggest challenges in EPC portfolio management is that performance data usually ends up scattered across different systems and teams. Each project creates its own reports, metrics, and records, but without a common place to bring that information together, spotting trends or outliers takes far too much time.
Tools built for this use case take a more practical approach. Cloud EPC functions as an integrated project management environment where users can search and filter across both active and historical projects to quickly review key performance indicators. In practice, that means a project controls lead can pull up comparable past projects in seconds instead of digging through archived files or spreadsheets.
The value is straightforward. When teams can compare a live project against similar completed work, it becomes much easier to catch schedule drift and cost variance early, before they turn into larger delivery problems. It also helps project managers identify opportunities to apply best in class practices from similar EPC projects.
Using Cost, Schedule, and Delivery Data to Improve Bid Accuracy and Governance
Good benchmarking data does more than support project tracking. It improves the quality of decisions before a project even starts, especially when teams use project efficiency measures and formal studies apply a series two-stage DEA model to assess EPC project efficiency effectively. Estimators and bid teams that can access consolidated cost, schedule, and delivery performance from previous work are in a much stronger position to price accurately and set timelines that hold up in the real world. Studies also found that only 25% of EPC projects were ex ante efficient, while median efficiency across EPC projects was about 90%. They further showed that 58% of projects demonstrated operational efficiency, and benchmark results indicate EPC performance can improve by reducing costs and duration by 17%.
That is where bringing engineering, procurement, and construction data into one environment starts to pay off. As Cloud EPC shows, consolidating schedule, cost, and performance records across EPC portfolios creates a benchmarking layer that supports not just execution, but the planning and governance decisions that come before it.
For owners and PMOs, that level of visibility also strengthens control. When leadership can point to verified historical performance on similar projects, budget approvals, contractor reviews, and milestone commitments are based on evidence, not guesswork. Better project management also means better project success rates because the team can assess risk earlier and align resources with the work breakdown structures that matter most.
Portfolio-Level Dashboards for Executives, Owners, Project Controls, and Project Management Teams
Different stakeholders need benchmarking data in different formats, including executives, project controls engineers, and epc contractors. An executive looking at portfolio health needs a broad view across all active projects. A project controls engineer needs the ability to drill into schedule progress, earned value, or procurement status at the individual project level. A strong benchmarking tool has to support both without making users bounce between disconnected systems.
Cloud EPC does this by consolidating performance data across engineering, procurement, and construction projects into a unified environment, giving users at different levels of the organization access to the same source of truth while still letting them filter and navigate based on what they need to see.
For capital project owners managing large portfolios, that kind of visibility is not just useful. It is part of good governance. When leadership and delivery teams can see how projects compare against one another and against historical baselines through usable views of the same benchmark data, they can allocate resources more effectively, spot underperforming work sooner, and make more efficient portfolio decisions on new projects before execution begins.
How to Choose the Best EPC Benchmarking Tool for Your Organization
Choosing an EPC benchmarking tool may look simple at first. In practice, it has long-term consequences for how your team estimates, validates, and manages performance. Pick the wrong one and you can end up with weak data integration, poor scalability, or benchmarks that don’t match how your projects or assets actually run. Pick the right one and it becomes part of how your organization makes cost decisions and measures improvement over time.
This section lays out a practical way to evaluate your options, from domain fit and data quality to vendor validation and total cost of ownership.
Match the Tool to the EPC Domain: Telecom Core, Building Energy, or Capital Projects
Not every EPC benchmarking tool is built for the same job, and that’s where a lot of teams get tripped up during selection. The needs of a telecom infrastructure group are very different from those of a building energy consultant or a capital projects leader managing a refinery expansion.
In telecom, the tool needs to handle network performance metrics, equipment deployment costs, and rollout benchmarks at scale. In building energy, the focus shifts to energy performance standards, carbon intensity, and compliance requirements. In capital projects, you need support for multi-discipline cost structures, labor productivity benchmarks, and commodity price swings across long project timelines.
Before you look at vendors, define your domain clearly. A tool that works well in one environment may fall short in another, even if the demo looks polished. Ask vendors directly how they handle the cost categories, units of measure, and benchmark libraries that matter in your sector. If they can’t answer that with confidence and detail, that’s a warning sign.
Evaluate Benchmark Data Inputs, Integration Requirements, and Benchmark Validity
Benchmarking is only as good as the data behind it. So when you evaluate tools, whether for internal use or to support clients, move past the feature checklist and dig into how data is sourced, validated, and refreshed.
Start with data inputs. Can the tool take in your project history, cost records, and third-party datasets without a lot of manual cleanup? Integration matters here. If the tool sits off to the side as a separate system, it creates silos and forces your team to spend time reconciling data instead of using it.
Benchmark validity is just as important. Ask how the benchmark library is built, how often it’s updated, and what methods are used to normalize data across project types, regions, and time periods. If the data is outdated or the scope boundaries are fuzzy, the comparisons won’t help much.
Interoperability with your existing environment should be treated as a requirement, not a nice-to-have. Whether you’re working with a cost management tool, an ERP, or a project controls system, data needs to move cleanly between them. Otherwise, the team ends up spending more time managing spreadsheets than making decisions. ERP systems can also reduce data silos in EPC projects when the benchmarking tool is designed to connect cleanly.
Prioritize Reporting, Scenario Analysis, Automation, and Executive Dashboards
A tool can produce solid benchmark results and still miss the mark if it doesn’t present them in a useful way. Executives need clear takeaways. Project teams need detail. The better tools deliver reporting and automation benefits to both without creating separate workflows for each audience.
When you review reporting features, look for configurable dashboards, filtering by project type, phase, geography, or cost element, and export options that fit how your organization already shares information. That keeps reporting practical instead of forcing teams to work around the software.
Scenario analysis is where benchmarking tools can really add value. If you can model changes in scope, market conditions, labor rates, or material costs, you move from simply reviewing performance to planning ahead. A tool that only shows where you stand today is useful, but limited. The real value comes from understanding where a project may land if conditions shift.
Automation matters more than many teams expect. Manual data prep and recurring report builds take time and introduce inconsistency. Tools that automate ingestion, benchmark calculations, and scheduled reporting give your team more room to focus on interpretation and action. They also support project controls teams that need reliable access to performance metrics without rebuilding reports every cycle.
User experience matters too. An estimator and a CFO are looking for different things in the same dataset. A well-designed tool makes that easier, rather than forcing one group to translate everything for the other. Nomitech tools, for example, are often evaluated on this point because teams want both technical depth and reporting clarity in the same workflow.
Create a Vendor Shortlist Using Proof-of-Concept Benchmarks
Once you’ve clarified your domain, integration needs, and reporting priorities, the next step is to narrow the field with structured testing instead of relying on polished vendor presentations.
A proof-of-concept benchmark is one of the best ways to see whether a tool performs the way it claims. Use a representative sample of your own project data and run it through the software in a controlled setting. Then compare the outputs with benchmarks you already trust. You’re looking for results that are defensible, consistent, and easy to explain.
Pay attention to how the vendor supports the process as well. Responsiveness, transparency about limitations, and a willingness to adapt the tool to your data environment all tell you something about the relationship you can expect after purchase.
Your shortlist should also reflect total cost of ownership, not just the license fee. Implementation, data migration, training, support, and the internal time needed to keep the tool running all add up. A solution that looks affordable upfront can become expensive once the full lifecycle is included.
Security and compliance should be checked during the proof-of-concept stage too. Depending on your industry and region, data residency, access control, and audit trails may be mandatory. Confirm those requirements early. Don’t leave them for later.
By the time you’re ready to choose a vendor, you should be well past the marketing materials and into evidence-based comparison. The goal is a tool your team will actually trust, use, and build around over time. Best in class solutions usually make benchmark data accessible enough for project managers while still giving analysts the depth they need for operational research.
Frequently Asked Questions
What are EPC benchmarking tools?
EPC benchmarking tools compare performance against defined baselines, but the meaning depends on the domain. In telecom, they benchmark Evolved Packet Core and 5G Core performance. In buildings, they compare Energy Performance Certificate data. In engineering, procurement, and construction, they benchmark project cost, schedule, procurement, productivity, and delivery outcomes.
Why is it important to define the EPC use case before comparing vendors?
The same term can refer to completely different disciplines. If teams do not define the use case first, they may evaluate tools built for the wrong environment, track the wrong KPIs, and choose software that does not support the decisions they need to make.
What KPIs matter most for EPC project benchmarking?
For engineering, procurement, and construction portfolios, important KPIs include cost per unit of installed scope, schedule performance index, procurement cycle time, and productivity rates for key trades. These metrics are most useful when project data is standardized and comparable across active and historical work. Project controls teams should also collect data consistently so the benchmark data stays credible.
What should building owners look for in EPC benchmarking software?
Building owners should look for standardized and reproducible scoring, peer comparison at scale, regulatory reporting alignment, portfolio-level visibility, and audit-ready records. These features help teams move beyond static reports and manage energy performance across larger portfolios.
How should organizations validate an EPC benchmarking tool before purchase?
Organizations should run a proof-of-concept benchmark using representative project or performance data. The goal is to test whether the tool produces defensible, consistent, and explainable results while also confirming integration, security, support, and total cost of ownership.
Implementation Roadmap: Turning EPC Benchmarks Into Measurable Improvement
Collecting benchmark data is only half the job. The real value comes from putting it to work. For EPC organizations, that means turning comparisons into decisions, decisions into budgets, and budgets into accountability. Here’s how to move from raw data to a practical improvement program.
Step 1: Establish Baselines, Use Cases, and Decision Criteria
Before you compare anything, you need to be clear on what you’re measuring and why. Without a defined baseline and decision criteria, benchmarking tends to produce interesting charts that nobody acts on.
Start with the KPIs that matter most to your organization. That might be cost per installed unit, labor productivity, material waste, or estimate accuracy at different project stages. The right metrics depend on your project mix, delivery model, and where your teams see the most variation.
Once the KPIs are set, document the current state. Pull historical project data from ERP systems, standardize how costs are captured across jobs, and flag any data gaps that could distort the results. Inconsistent data is one of the biggest reasons benchmarking efforts fail to produce usable insight.
It also helps to define the decision criteria early. What would a benchmark need to show before the team approves a process change, a new tool, or a resource shift? Setting that threshold up front keeps the results honest and avoids selective interpretation later.
Use cases should be scoped clearly at this stage too. Are you benchmarking estimating accuracy across project types? Comparing contractor performance by region? Testing whether a new cost modeling approach outperforms the current one? Each question needs its own baseline and success criteria, and each one should support a clear improvement plan.
Step 2: Run Controlled Tests or Portfolio Comparisons
With baselines in place, the next step is building comparisons that actually tell you something useful. In practice, there are two common approaches.
The first is a controlled test. You apply a new process, tool, or method to a defined group of projects while the current approach continues on comparable work. This is a good fit when you want to test a specific change, such as whether a revised estimating workflow reduces variance during proposal development.
The second is a portfolio comparison. Here, you look across a wider set of completed or active projects to identify patterns. This works better when you’re trying to understand larger issues, such as which project types regularly run over budget or which phases create the most estimate drift.
Either way, data quality matters. The comparison is only as strong as the inputs behind it. Project scope, complexity, and delivery conditions should be as comparable as possible, and cost data needs to be recorded consistently across the set. Collect data in a way that allows teams to compare similar EPC projects fairly and adjust for project size where needed.
This is also the stage where documentation pays off. Teams should capture not just the numbers, but the context behind them. A project that ran 15% over because of an unexpected site condition tells a very different story from one that missed because of a poor quantity take-off. Separating controllable variance from outside factors is what reveals real improvement opportunities.
Modern cost estimating software can make this much easier by keeping project cost data structured and auditable. When teams can tag costs by phase, resource type, and project characteristics, those comparisons become far less manual. Nomitech solutions are a good example of how that structure supports cleaner analysis without adding unnecessary overhead.
Step 3: Translate Benchmark Results Into Roadmaps, Budgets, and Accountability
This is where a lot of organizations lose momentum. The benchmark report gets reviewed, everyone agrees there’s an issue, and then the findings sit in a deck. To avoid that, convert the results into clear next steps with owners, timelines, and funding attached.
Start by grouping the gaps you’ve found. Not every issue needs the same response. Some point to quick process fixes with minimal effort. Others suggest deeper problems, such as recurring underestimation in a specific project category, that may call for training, tool changes, or better field data capture.
From there, build a prioritized roadmap that links each gap to a specific action, budget requirement, and accountable owner. Use the decision criteria from Step 1 to set priorities. If estimate accuracy at the proposal stage was one of your key KPIs, improvements there should move ahead of less critical issues, even if they seem more visible. That is one reason leading companies treat benchmarking as part of project management rather than a side exercise.
Benchmark data also makes budget discussions much more straightforward. Instead of asking for funding in general terms, you can point to specific performance gaps and the cost of leaving them unresolved. That shifts the conversation from, “Can we afford this?” to, “What does it cost us if we don’t act?” Effective cost controls are easier when project controls teams can tie benchmark data directly to budgets and schedule outcomes.
Finally, set review cycles. A roadmap without checkpoints tends to drift. Schedule regular reviews to see whether the actions taken are moving the KPIs in the right direction. That closes the loop and turns benchmarking from a one-time exercise into a repeatable improvement process that gets stronger over time. It also helps organizations compare actual project outcomes against expected project success criteria.
Ready to Take the Next Step?
If you’re exploring modern cost estimation platforms, check out Nomitech’s full suite or get in touch with our team to find the right fit for your workflows.





Stay Up to Date
Subscribe to our Newsletter today and receive the latest updates, trends, expert insights, and exclusive offers tailored to your specific industry.