

How to Benchmark a New Project: Cost, Schedule, Performance
TL;DR: Benchmarking a new project helps teams set realistic cost, quality, and resource targets before execution begins.
By using clear objectives, focused KPIs, reliable historical data, and a repeatable review process, leaders can make better approval decisions and reduce delivery risk.
How to Benchmark a New Project: Strategic Definition and Business Value
New projects often begin with pressure before they begin with clarity. To benchmark a new project, project managers, estimators, executives, and delivery teams measure expected or early actual performance against a defined reference point using clear objectives, focused KPIs, reliable historical or industry data, and a repeatable review process to sset realistic cost, carbon, and quality targets before execution begins. Without a reliable benchmark, early approvals can end up resting on assumptions that are hard to defend later.
That is what makes benchmarking a new project both urgent and difficult, especially in capital-intensive or technically complex environments. Scope creep can expand quickly, bid margins can tighten, and fragmented data can make similar projects look less comparable than they really are. Leaders still need answers: How does this project compare with previous work? Are the cost targets realistic? Where is the biggest exposure? Strong benchmarking helps close the gap between approval expectations and delivery reality, so risks surface earlier, accountability improves, and business cases become more credible.
Done well, benchmarking gives executives, estimators, and project teams a shared basis for comparing cost, carbon emissions, quality, and overall value, before full execution begins. This article walks through the strategic role of benchmarking, how to define scope and objectives, choose the right metrics, build baselines from historical and industry data, analyze gaps and root causes, communicate findings to leadership, and make the process repeatable for continuous improvement. It also shows where tools like CostOS and Nomitech benchmarking solutions can help teams regain control. Before that, it helps to distinguish the three primary benchmarking approaches—internal, competitive benchmarking, and strategic—since competitive benchmarking, in particular, compares products, services, and operating metrics against direct competitors to reveal industry gaps and set stronger performance targets; first, let’s clarify what project benchmarking actually means for new initiatives.
What Project Benchmarking Means for New Initiatives
At its core, project benchmarking means measuring a project’s expected or actual performance against a defined reference point. That reference point might be internal project history, industry standards, or comparable work from peer organizations of the same type.
The comparison matters, but the intent behind it matters even more. According to LinkedIn, meaningful benchmarking starts with clear goals and metrics. Without them, comparisons are easy to misread and even easier to misuse. You may have numbers, but not much insight.
For new projects, benchmarking should start during planning, not after delivery. The early questions usually look like this:
- What performance measures matter most for this initiative?
- What historical data do we have from similar projects?
- How will we measure progress against those targets as the work moves forward?
Seen this way, benchmarking is more than a retrospective check. It becomes a forward-looking governance tool that helps teams set realistic targets and gives leadership a defensible basis for approving a project.
Why Benchmarking Improves Project Governance and Executive Decisions
One of the most common breakdowns in project governance is the gap between what leadership approves and what the team can realistically deliver. Benchmarking helps close that gap by grounding decisions in comparable data instead of optimistic assumptions.
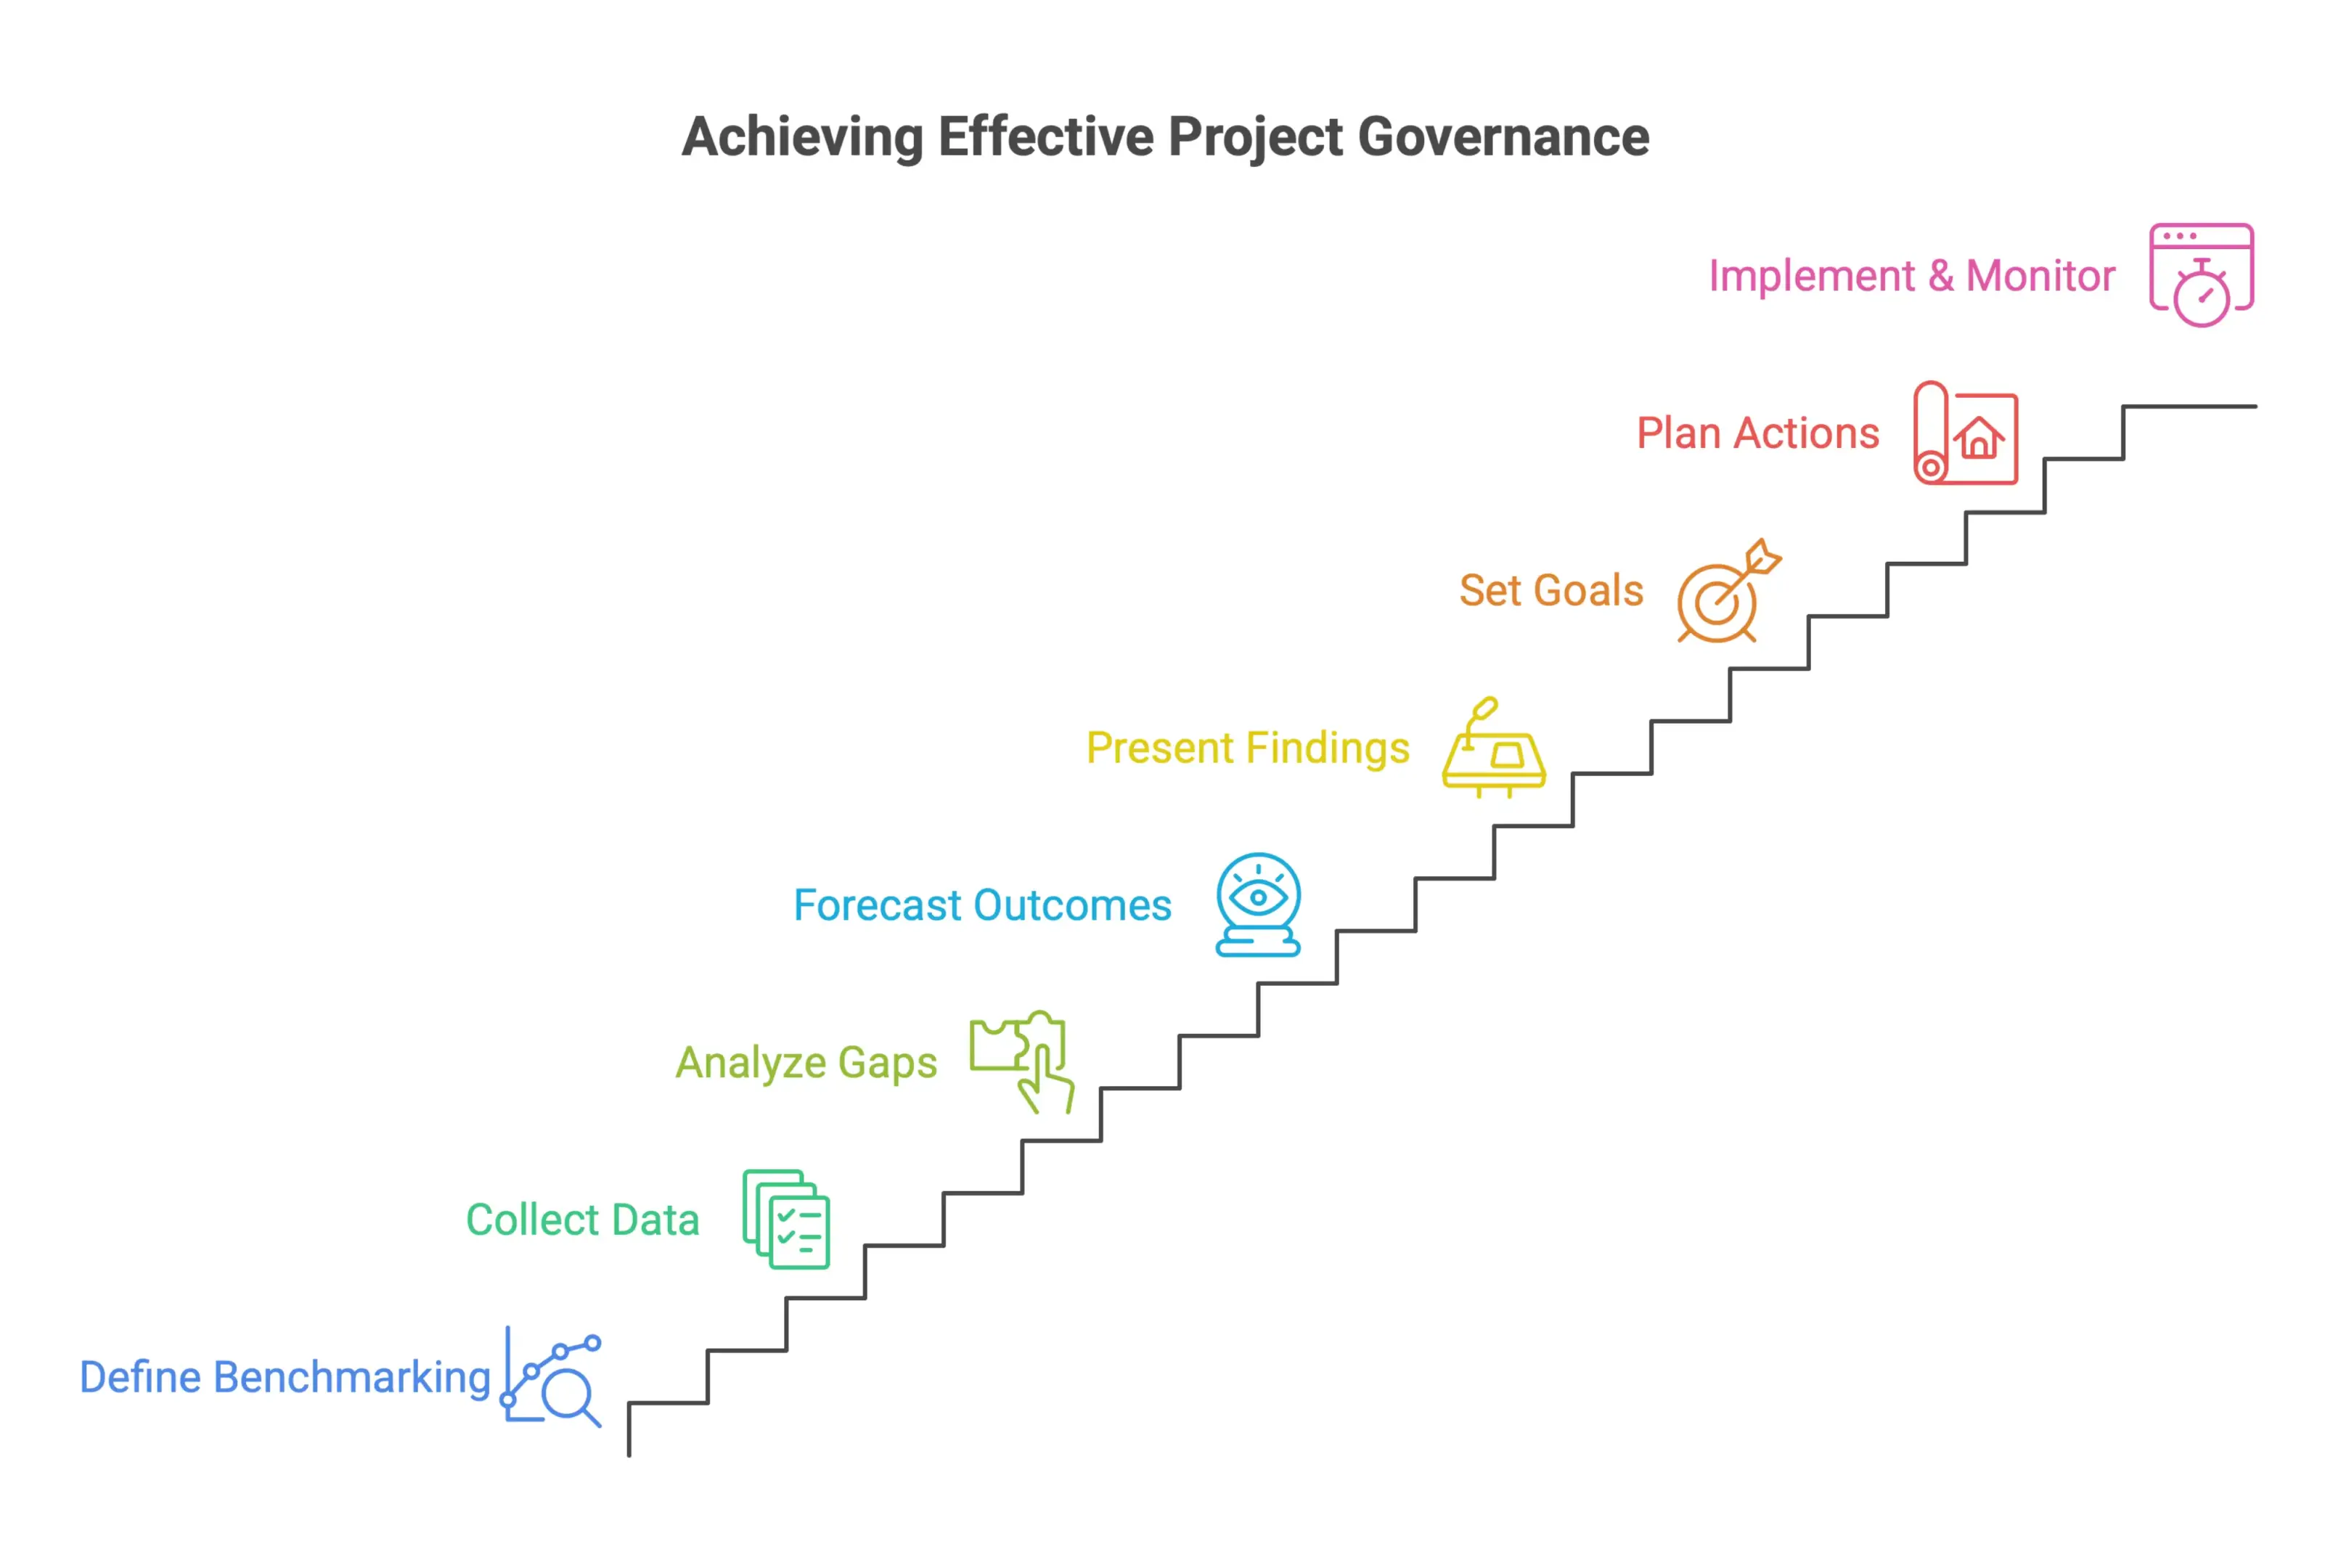
Independent Project Analysis (IPA) ews/article/what-is-project-benchmarking/) lays out a structured ten-step benchmarking process that shows how deliberate this work needs to be. It starts by defining what will be benchmarked and which projects, organizations, or another company are relevant for comparison. From there, it moves through data collection, gap analysis, and performance forecasting before the results are presented to leadership.
That order matters. By the time decision-makers see the findings, they are looking at analyzed data, identified gaps, and forecasted outcomes, not raw figures they have to interpret on the spot.
The IPA framework also makes one thing clear: benchmarking does not stop at the report. It continues through goal-setting, action planning, implementation, and ongoing monitoring, with benchmarks adjusted over time to support continuous improvement.
For project governance, that creates several practical benefits:
- Clearer approval criteria: Leaders can evaluate new projects against proven performance baselines, not internal estimates alone
- Stronger accountability: When targets are tied to benchmarked data, teams share the same reference point for progress and corrective action
- More credible business cases: Benchmark-driven projects are easier to defend because the assumptions behind cost targets come from comparable evidence
For organizations running capital-intensive or technically complex work, this level of discipline matters. It is often the difference between a project that delivers its expected value and one that slowly erodes it. If your team needs a stronger basis for comparing forecasts with actual delivery, CosMO™ – Cost Modeling & Benchmarking can help centralize historical cost data and benchmark performance more consistently.
Start With Clear Objectives, Scope, and Success Criteria
One of the easiest ways to weaken a benchmarking effort is to jump straight into data collection. Without a solid foundation, teams compare the wrong things, involve the wrong people, or produce results that no one fully trusts.
A little discipline at the start makes the rest of the process cleaner. Here’s where to begin.
Define Project Objectives Before Selecting Benchmarks
Before you decide what to measure or where to pull comparison data from, get clear on why the benchmarking exercise exists. It sounds obvious, but teams often start gathering data first and try to define the goal later. That usually creates noise, not insight.
The UK Cabinet Office recommends starting any benchmarking process by confirming project objectives and metrics as the first step. Only after that does it make sense to break the project into major components and build the data structure needed for analysis. The logic is simple: objectives shape the metrics, and the metrics shape everything else.
In practical terms, that means asking:
- What decision will these benchmarks support?
- What does success look like for this project?
- Which project components need to be measured, and how much detail is actually useful?
Answering those questions early keeps the scope tight and stops the process from drifting into areas that do not support the original goal. It also helps determine which business goals matter most, so the benchmarking process stays tied to project success and helps measure performance against the objectives that matter most instead of chasing extra data for its own sake.
Align Stakeholders on Scope, Timeline, and Success Criteria
Even a clear objective can fall apart if the people involved are working from different assumptions. Stakeholder alignment is not just a project management formality. It has a direct impact on whether your benchmarking results are useful, credible, and acted on.
Venko describes a benchmarking process that starts with a dedicated planning phase covering objectives, stakeholders, scope, timeline, and success criteria, while ensuring stakeholders have access to the relevant documentation and source data, before any metrics are selected or data is collected. That order matters. When everyone agrees upfront on what is in scope, how long the process will take, and how success will be judged, there is far less room for confusion later.
For technical teams, this conversation should cover:
- Scope: Which project phases, cost categories, or work packages are included in the benchmark?
- Timeline: When does data need to be collected, checked, and ready for decision-making?
- Success criteria: What does a useful benchmark look like for this project? A cost-per-unit figure or something else?
That alignment matters even more when the project team, sponsors, and reviewers will use the benchmark in different ways.
Documenting those answers before the work begins gives the team a shared reference point. It keeps the process accountable and makes the final output much easier to use. If you need a structured way to standardize those inputs, the Cost Breakdown Structure can help organize project costs into a clearer hierarchy.
Choose the Right Project Benchmarking Metrics
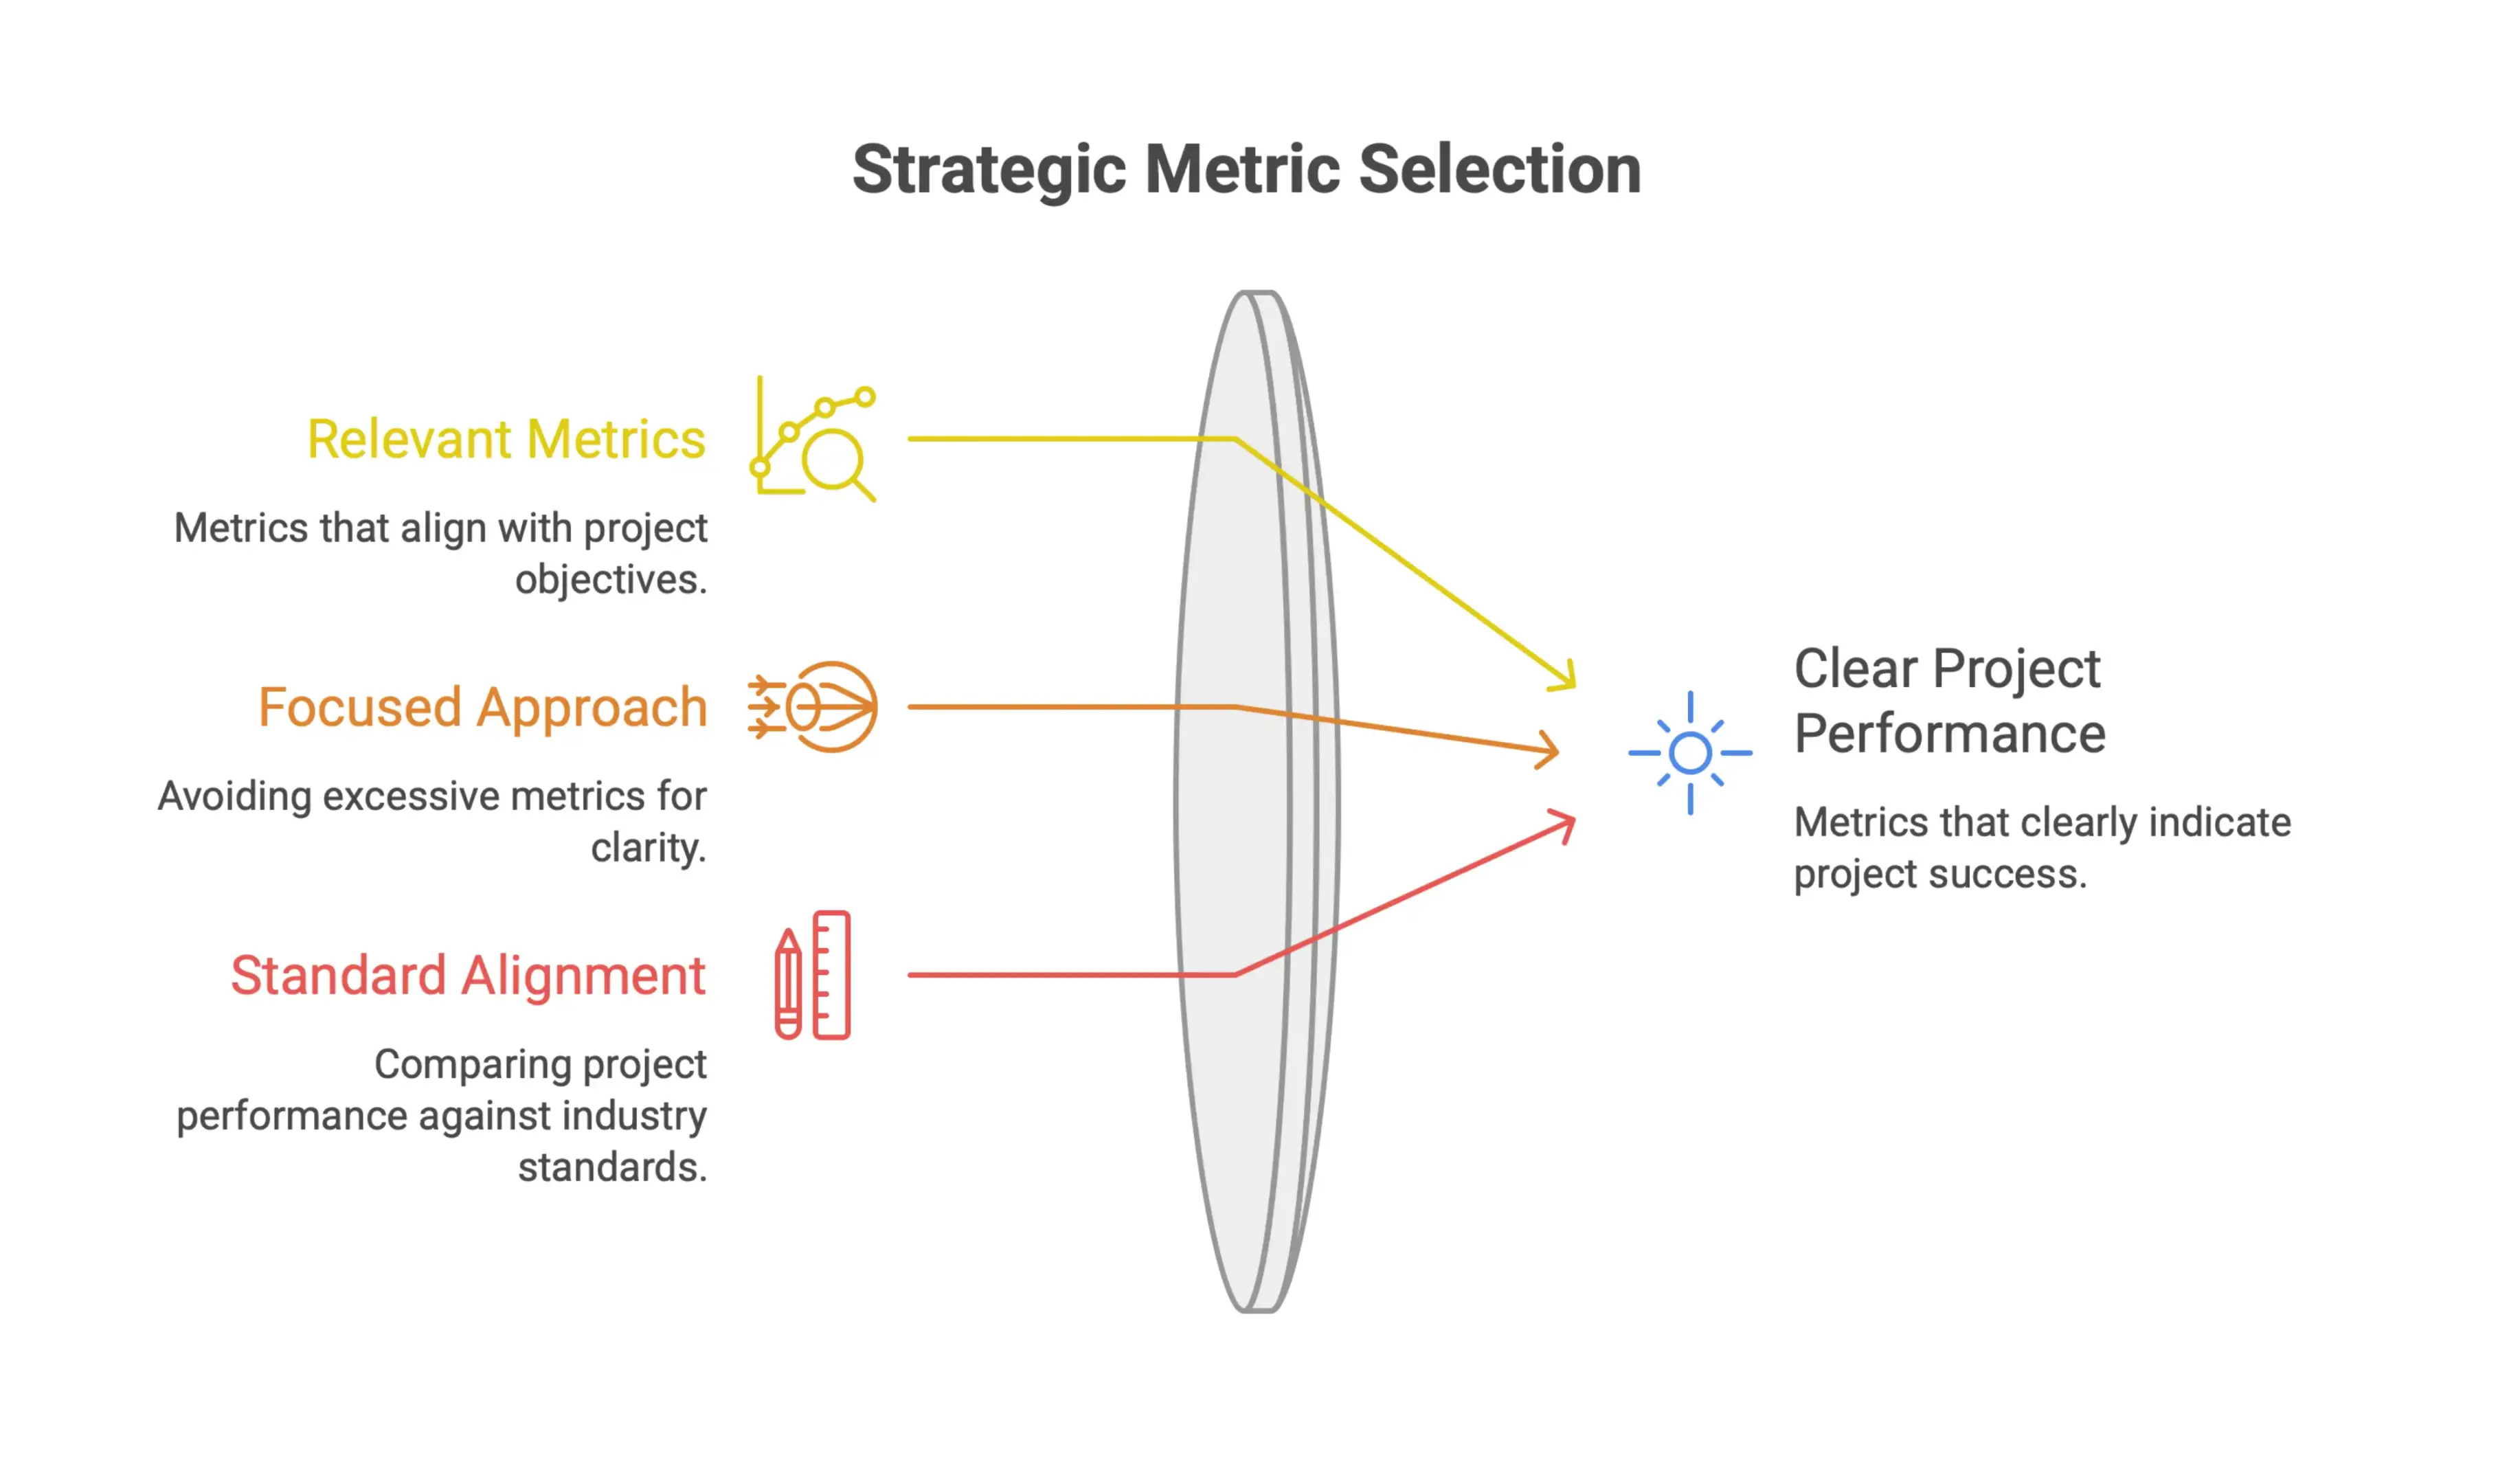
Not every metric deserves equal attention. One of the most common mistakes when benchmarking a new project is tracking too much at once. More numbers can feel safer, but they often make the picture less clear. The real goal is to focus on the metrics that show how the project is performing against standards that matter.
Focus on a Small Set of High-Impact Project KPIs
More data does not automatically mean better decisions. As monday.com notes, effective project benchmarking comes from choosing a small set of high-impact metrics instead of trying to measure everything. For cost- and carbon-focused benchmarking, these may include cost performance index, cost variance, cost per unit, carbon intensity, quality scores and value-delivery measures.
That shifts benchmarking from basic progress tracking into something more useful. You are no longer just asking whether the project is moving forward. You are comparing it against industry standards and using that comparison to make better decisions. Instead of debating whether a project is “on track,” you have evidence that shows where it stands.
A good place to start is with one simple question: which metrics would hurt the project most if they moved in the wrong direction? Build your benchmarking framework around those and the team capabilities they reveal.
Benchmark Cost, Carbon, Quality, and Client Satisfaction
Once you know which metrics matter, the next step is to benchmark them consistently. Teamwork lays out a practical cycle for doing this well: define what you are measuring, compare it to standards, collect the data, analyze the results, act on them, and then recalibrate.
For this cost- and carbon-focused framework, useful benchmarking anchors include:
- Cost performance index (CPI) to measure how efficiently budget is being used, while budget variance compares budgeted financial expenditures with actual spending
- Carbon intensity to compare carbon emissions per square metre or another relevant functional unit
- Client satisfaction scores to capture how the client actually experienced the project
Teamwork also recommends a tiered review rhythm: monthly reviews for operational metrics and quarterly reviews for strategic ones. That keeps benchmarking active without turning it into another admin burden. It also helps teams identify performance gaps where the current project performance is drifting before issues become harder to correct.
Apply ICMS to Cost and Carbon Benchmarking
The International Cost Management Standard provides a consistent framework for classifying, reporting and comparing construction costs and carbon emissions. ICMS can be applied to historical, current and future project data, making it relevant when benchmarking a new project against completed work or alternative design options.
ICMS 3 applies an aligned reporting structure to costs and carbon emissions. This allows teams to compare information by project, category and group while clearly documenting what has been included or excluded. Cost data can cover acquisition, construction, renewal, operation, maintenance and end-of-life costs, while carbon emissions can be reported in kilograms or tonnes of carbon dioxide equivalent.
Using a consistent ICMS structure makes cost and carbon benchmarking more reliable because projects are compared using the same classifications, reporting boundaries and measurement basis.
Use Forecasting and Satisfaction KPIs to Measure Project Value
Some of the most useful benchmarks are the ones that help you see what is coming next. Jile points to Estimate at Completion, or EAC, as a key forecasting metric for benchmarking cost predictability across the project lifecycle. Instead of waiting until closeout to understand financial performance, EAC gives you a live view of where the final cost is likely heading, while actual cost shows the real spending being tracked against that forecast. That gives teams time to correct course before small issues become expensive ones.
On the stakeholder side, Jile also highlights Net Promoter Score, or NPS, as a straightforward way to benchmark satisfaction. It turns a subjective reaction into a measurable signal, which makes it easier to track perceived project value across different engagements and over time, though no financial metric should stand alone and should be read alongside customer satisfaction and other value signals. Net Promoter Score and other customer satisfaction measures help compare what the project delivered versus what users expected.
Taken together, forecasting metrics like EAC and satisfaction metrics like NPS give you a fuller view of project performance. Cost show whether you delivered. Forecasting and satisfaction help show whether you delivered well, and whether the people involved thought it was worth it. For organizations that want a more complete view of value, CostOS™ – Advanced Cost Estimating Platform can support the underlying estimating and forecasting workflows behind these KPIs.
Build Reliable Baselines From Historical and Comparative Data
A useful benchmark does not really start in a spreadsheet. It starts with how well you organize the data behind it, where that data comes from, and how consistently you apply it across similar projects. If the reference set is messy or inconsistent, you end up comparing jobs that should not be in the same conversation. That is how bad assumptions creep into planning.
The two areas below are where teams usually either set themselves up for solid analysis or introduce errors early.
Segment Projects by Budget, Scale, Complexity, and Type
Not every project belongs in the same bucket, and benchmarking only works when you respect that. Comparing a small interior fit-out with a large infrastructure program may produce numbers, but they will not tell you much, especially if you do not account for project size even when two jobs look similar on the surface.
A better approach is to group your portfolio into clear categories before you start the analysis. According to ProjectManagementFormula, segmenting by budget, scale, complexity, and project type helps you build meaningful baseline averages across metrics such as, while also supporting process benchmarking as well as outcome benchmarking:
- Cost Performance Index (CPI)
- Cost variance
- Quality metrics
- Resource utilization or velocity
That same source recommends using at least 12 to 18 months of historical data when building those averages. That gives you enough history to spot real patterns instead of reacting to one unusual project.
Once the baselines are in place, ProjectManagementFormula also suggests testing active benchmarking on three to four projects within one defined segment before rolling it out more broadly. In practice, that makes it easier to pressure-test the method, tighten up templates, and catch weak points without putting the full portfolio at risk.
To keep the baseline useful, update it annually. Clear ownership matters here, along with consistent data governance. If the inputs are not maintained, the benchmark quickly loses value. This is also where tools like Nomitech can help teams keep historical data organized and easier to reuse across estimates and reporting cycles. The Cost Estimating Database for Accurate Construction Bids is a useful reference for organizing historical cost records into a more reliable baseline.
Use Industry Standards, Case Studies, and Competitive Benchmarking Databases
Internal data is a strong starting point, but it only shows how your own organization has performed. If you want to know whether that performance is competitive, or where you have room to improve, you need outside reference points too.
Priofy recommends using industry standards, published case studies, and benchmarking databases as part of a structured performance benchmarking process. These sources give you context beyond your own history and can highlight gaps that internal reporting will not reveal on its own. Some organizations also use a benchmarking consortium or outside consultants to obtain secure third-party comparison data.
The workflow Priofy outlines is straightforward:
- Define the metrics that matter for your project type
- Identify relevant external standards and benchmarks
- Collect project data, including historical records and team feedback, using reliable tools for quantitative and qualitative analysis
- Analyze the results to identify trends and areas for improvement
- Implement targeted changes based on those findings
- Monitor progress continuously over time
One important point in Priofy's guidance is that benchmarking is not a one-and-done exercise. Market conditions shift. Project complexity changes. Internal capability changes too. Teams that revisit benchmarks regularly tend to keep their baselines aligned with reality, while one-time reviews drift out of date fast. In that sense, benchmarking is a continuous improvement process that helps organizations compare current performance with past performance and industry peers.
Used together, internal segmentation and external benchmarking sources give decision-makers a fuller picture of performance. One tells you where you stand against your own history. The other shows how that compares with the wider industry or, where relevant, direct competitors. For teams building that kind of comparison library, CosMO™ – Cost Modeling & Benchmarking and Nomitech’s Product Range can support benchmarking, normalization, and broader cost modeling workflows.
Create a Repeatable Project Benchmarking Process
A benchmarking process only becomes useful when it becomes routine. Collecting data once is a start, but the real value comes from building a workflow your team can repeat and improve project after project. That means setting clear measures up front, testing the method before rolling it out widely, and updating benchmark figures as fresh data comes in.
Here is how to build that process from the ground up.
Follow a Structured Benchmarking Cycle
A benchmarking cycle gives your team a consistent framework to follow across every project, regardless of size or complexity. Without that structure, data collection tends to drift, comparisons become shaky, and the benchmarks lose their value quickly.
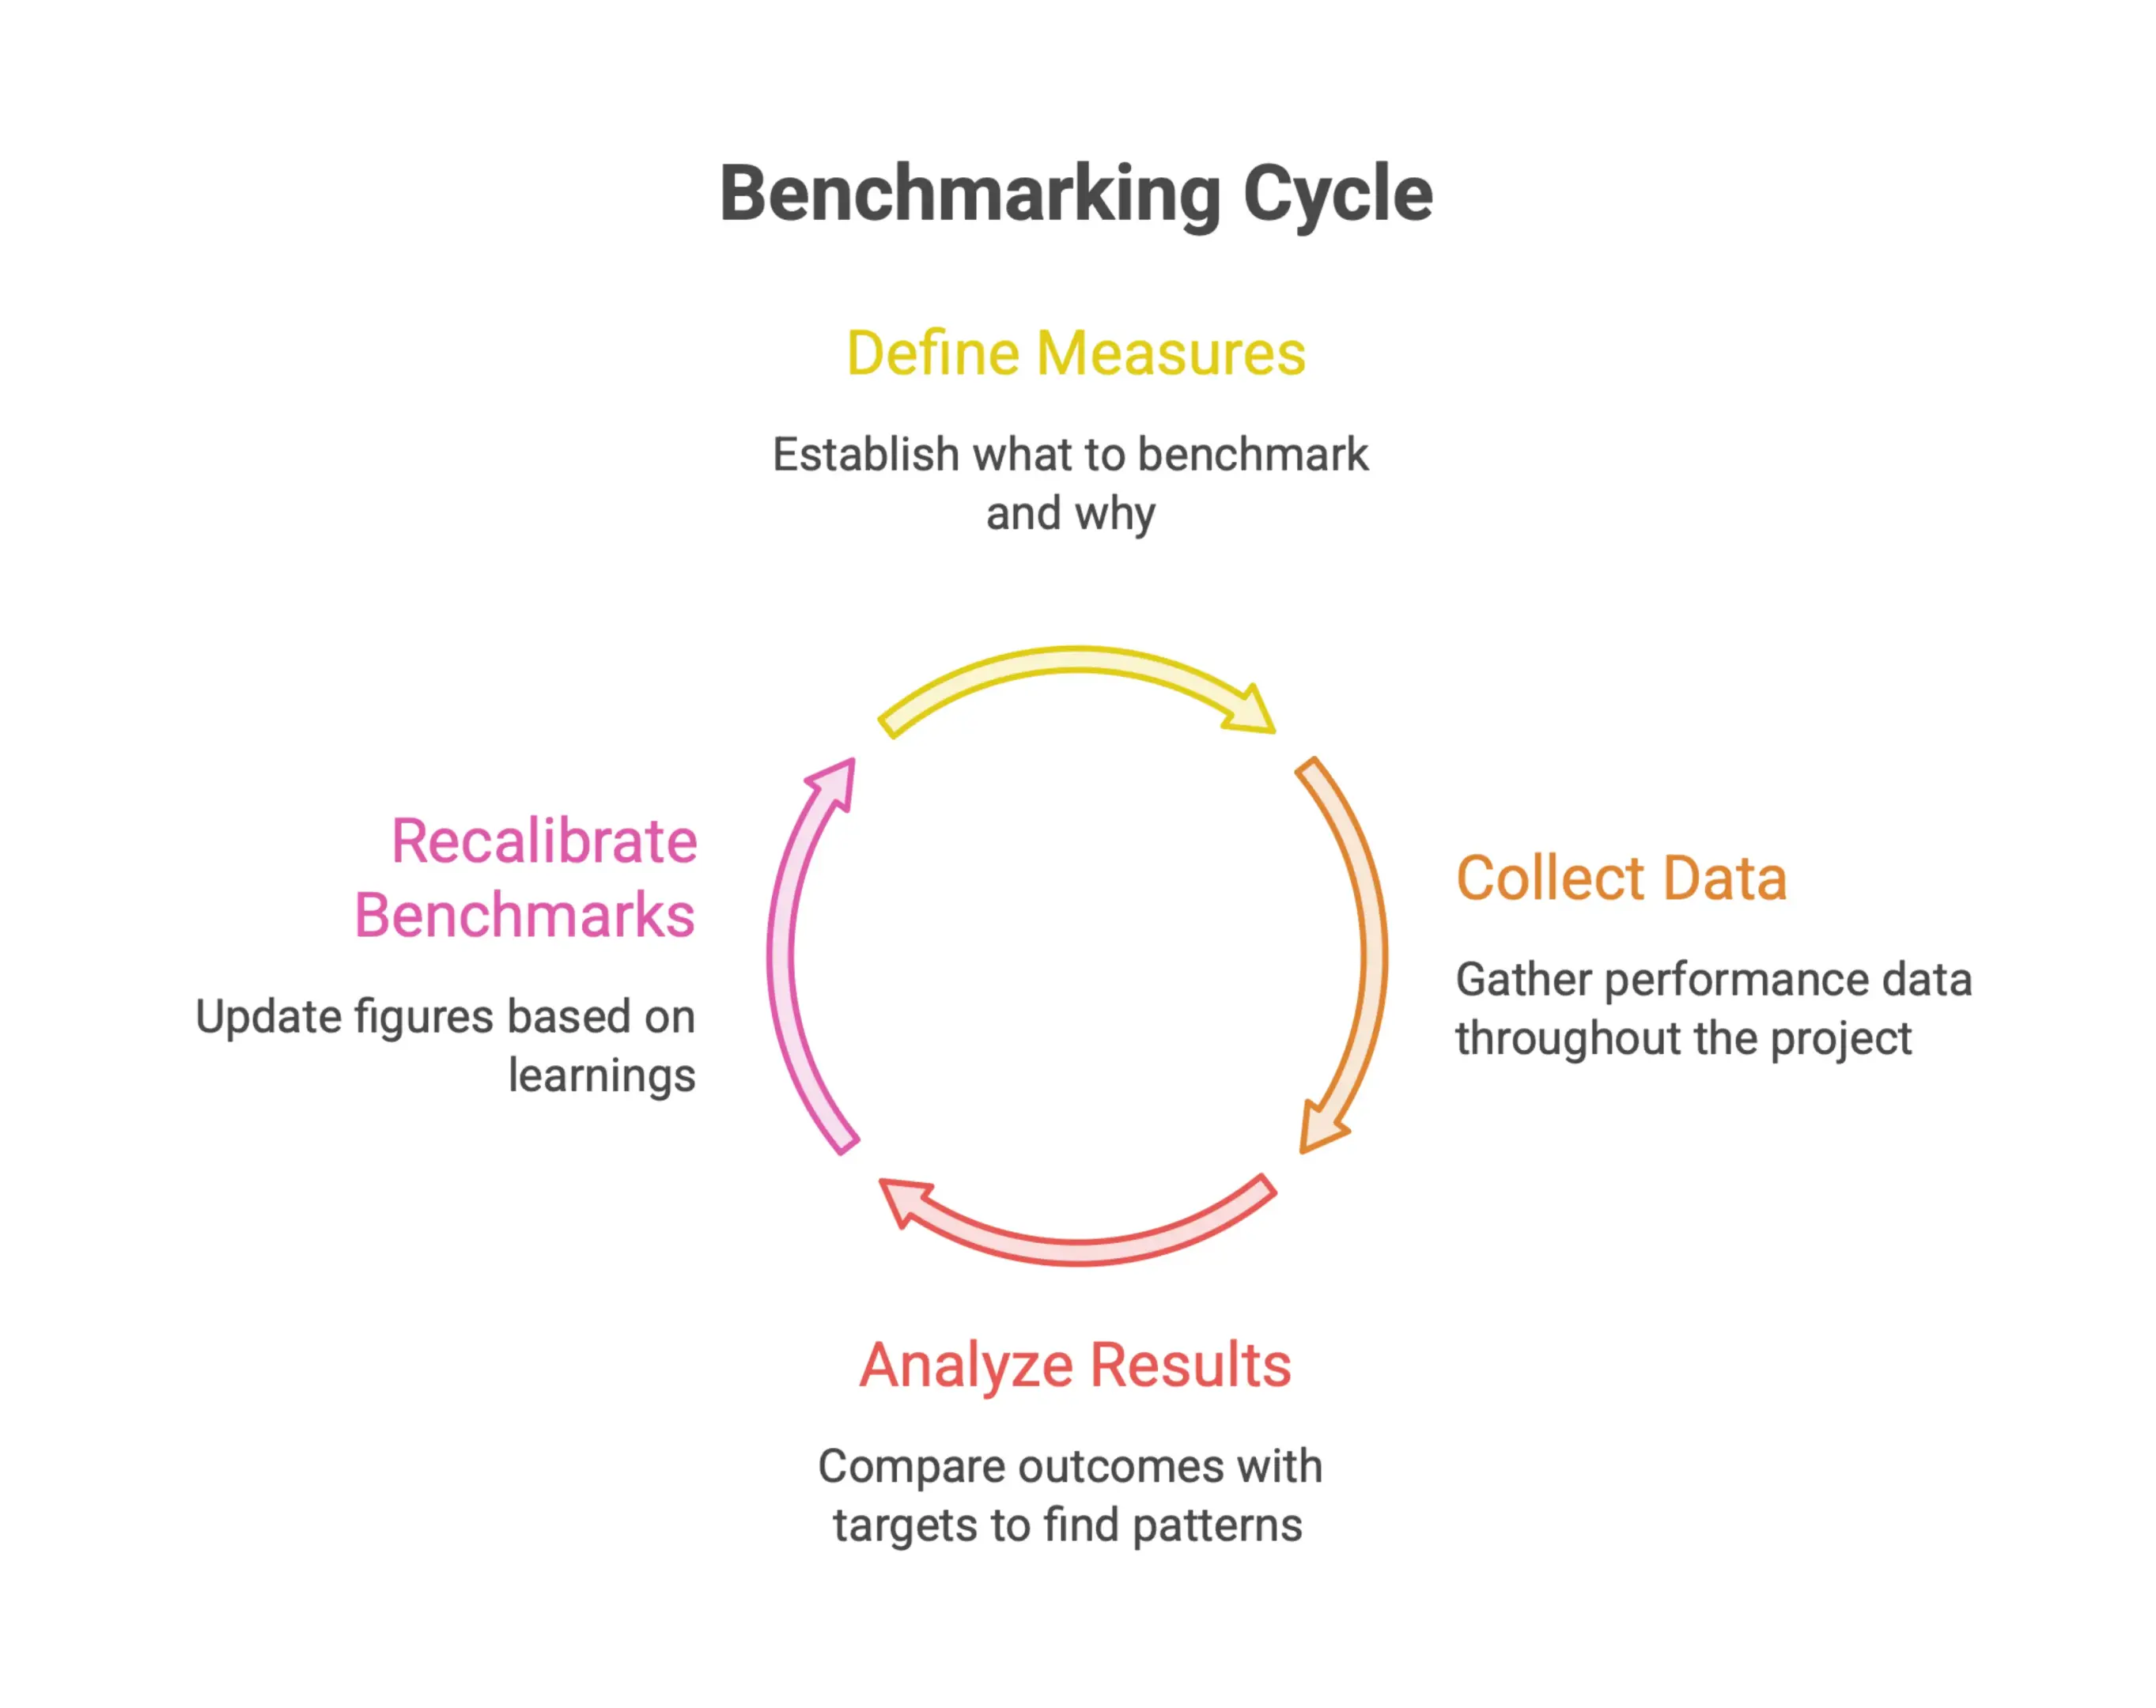
The cycle usually moves through these stages:
- Define your measures - Decide what you are benchmarking and why. Start with cost, carbon, and quality metrics as your baseline.
- Collect project data - Capture performance data consistently throughout the project lifecycle, not only at the end.
- Analyze results - Compare actual outcomes with benchmark targets to spot variances and recurring patterns.
- Recalibrate benchmarks - Use what you learn to update your benchmark figures before the next project starts.
When you set benchmark targets, it helps to think in more than one time frame. As NetSuite notes, organizations should look at short-, medium-, and long-term performance metrics when defining what good looks like for a project type. That keeps teams from optimizing for quick wins while weakening longer-term project performance.
Collaboration matters just as much. Benchmarking should not live in a single department. Involving stakeholders across business units when defining and reviewing metrics helps ensure the data reflects how the operation actually works, not just one team’s priorities. For some organizations, tools like Nomitech can help keep that information flowing through estimating and project planning workflows without turning the process into extra admin.
Validate, Re-Base, Test, and Refine Benchmark Figures
Benchmark figures are only as dependable as the process behind them. A baseline built two years ago for a very different project type may not tell you much today. That is why validation and refinement need to be part of the workflow, not an afterthought.
Once you have initial benchmark data, work through this cycle:
- Validate - Confirm that the data sources are accurate, that the metrics are truly comparable across projects, and that teams are using similar business processes before treating the work as like-for-like.
- Re-base - Update your baseline figures when project conditions, team structures, or delivery methods change in a meaningful way.
- Test - Apply your benchmarks to upcoming projects and see how well they predict actual performance.
- Refine - Adjust the figures based on what the testing shows, improving estimate accuracy over time.
Transparency is a big part of making this work in practice. NetSuite stresses that benchmark metrics and results should be shared clearly with all stakeholders, not just project managers. When the wider team understands how benchmarks are being used and updated, buy-in improves because people can see how the numbers map to real workflows and efficiency, and the feedback you get back is usually much more useful.
That kind of iteration turns your benchmark library into a working asset, not a static document that gets opened once and forgotten.
Pilot Benchmarking Before Scaling Across the Portfolio
One of the most common mistakes is trying to benchmark everything at once. Rolling a new process across an entire portfolio before it has been tested usually creates noise, inconsistency, and resistance from the people who are supposed to use it.
A better approach is to start small, prove the value, and then scale.
NetSuite recommends starting with a single project and keeping the first benchmarks focused on straightforward metrics like cost, carbon, and quality. That gives you a controlled setting to test data collection methods, prove the idea on a limited scope, find gaps in the process, and build confidence in the numbers before asking the wider organization to rely on them.
As the pilot matures and the process proves itself, you can gradually add more detail and extend the framework to other project types. This staged rollout also makes it easier to:
- Train estimators and project managers on the benchmarking workflow without overwhelming them
- Show how benchmarking can increase productivity or lower costs before expanding it across the portfolio
- Identify which metrics actually provide the most value for your project types
- Build organizational maturity around benchmarking at a pace the team can realistically absorb
Starting with one project is not a limitation. It is often the most practical way to build a process that will still hold up when the pressure increases. For teams that want a more structured rollout, Estimating to Benchmarking Workflow shows how to move from isolated estimates into a repeatable benchmarking cycle.
Analyze Benchmark Gaps and Identify Root Causes
Collecting benchmark data is only half the job. The real value comes from what you do with it. Once your project metrics are in hand, the next step is moving from observation to diagnosis. In plain terms, you need to understand not just where performance missed the mark, but why it happened and what needs to change.
Compare New Project Performance Against Baselines
Before you can spot a gap, you need a clear view of what the project actually delivered versus what the benchmark said it should deliver. That means lining up your collected metrics against the baseline and checking for deviations, such as higher-than-expected costs or carbon emissions.
This comparison should be deliberate, not rushed. Instead of scanning for the biggest outliers first, review each defined measure in a consistent way. Some differences will be minor and easy to explain. Others will point to a real issue that deserves attention.
This is where the work you did earlier starts to pay off. If your measures were clearly defined and your data collection process was solid, the comparison is straightforward. If not, some of the gaps you see may reflect data quality problems rather than actual performance shortfalls.
The U.S. Department of Energy outlines a structured benchmarking process that moves from data collection into deficiency identification. Comparison is not the finish line. It is the starting point for deeper analysis.
Turn Benchmark Variance Into Root-Cause Analysis
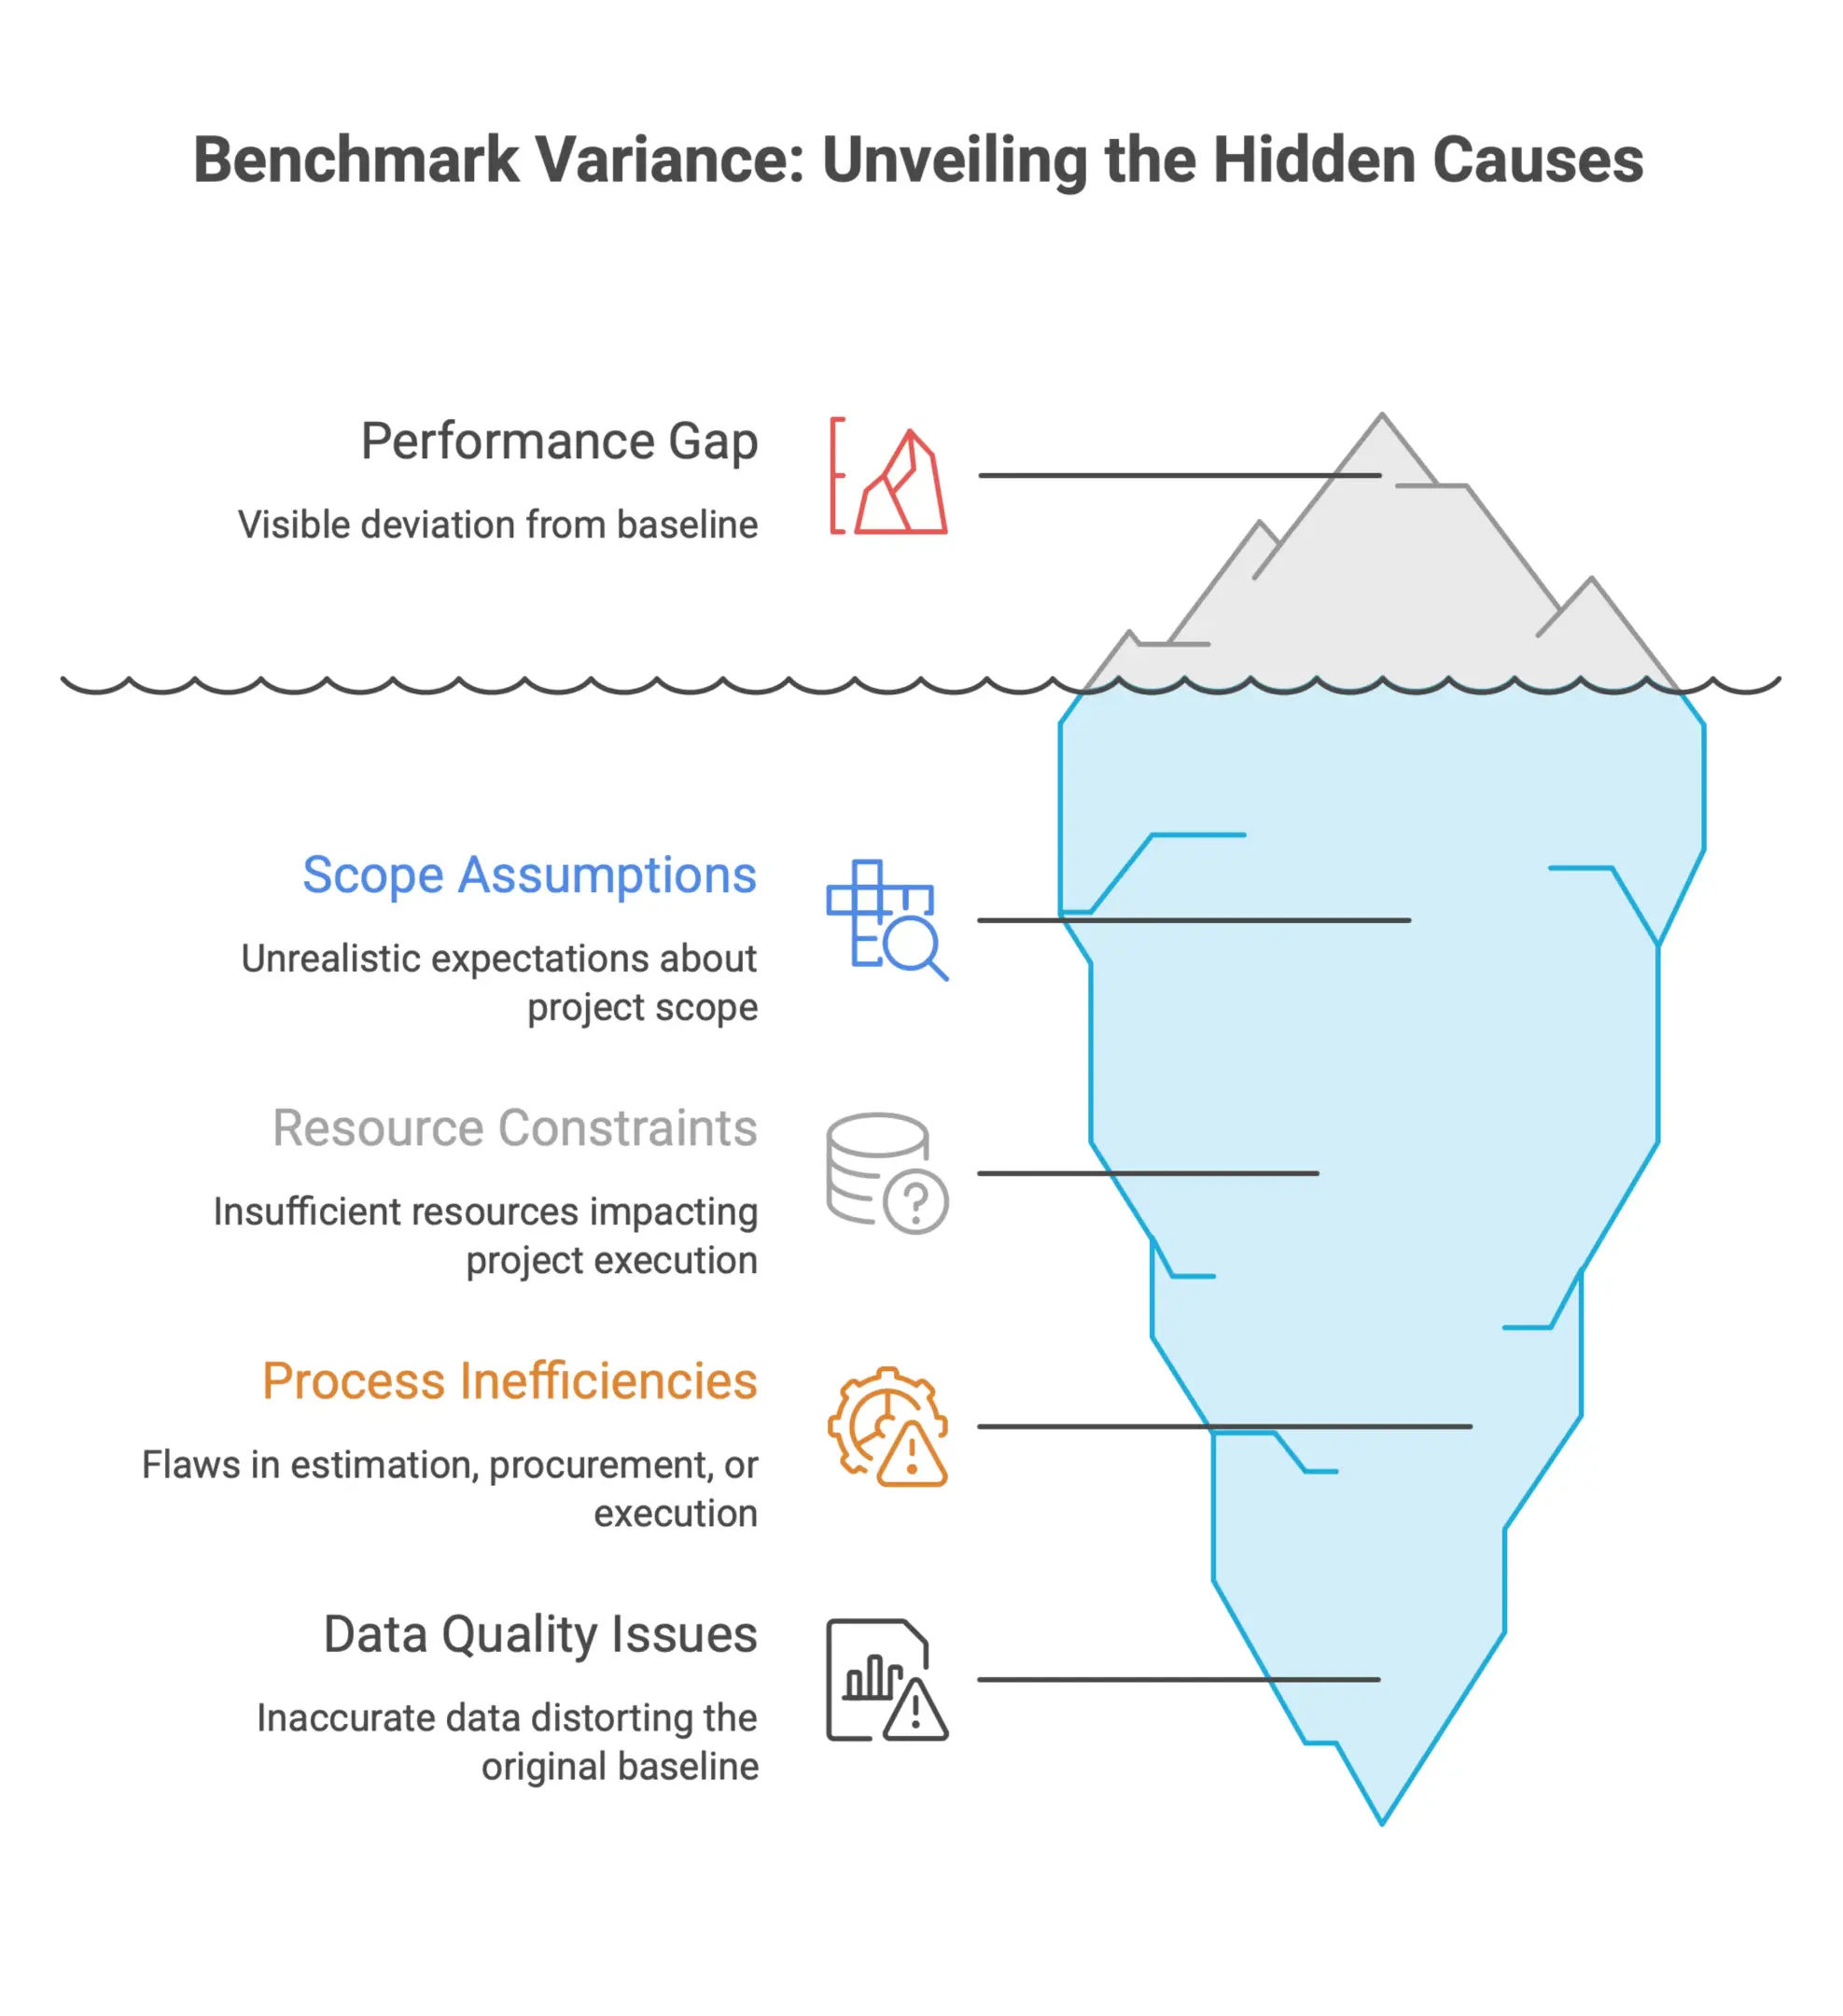
A performance gap is a signal, not a conclusion. Once you know where the project deviated from the baseline, the next step is to understand what caused that variance.
Root-cause analysis in benchmarking gets to the point quickly: what specific condition, decision, or process failure created the difference? Common causes include:
- Scope assumptions that did not hold up during execution
- Resource constraints that were not reflected in the benchmark model
- Process inefficiencies in estimation, procurement, or field execution
- Data quality issues that distorted the original baseline
The U.S. Department of Energy treats root-cause identification as a separate and necessary step in performance benchmarking. That separation matters because teams often stop too early and only describe the symptom.
In practice, that distinction is everything. A team that flags a cost overrun and leaves it there has identified a gap. A team that traces that overrun back to a specific estimating assumption or a recurring procurement delay has something useful to act on. The goal is to reach that second level every time.
Document root causes in a way that clearly links them to the gap that triggered the analysis. That creates a traceable line from performance data to diagnosis to response, which is exactly what teams need when they are trying to improve the next project. It also makes it easier to compare findings across completed projects and spot recurring patterns.
Prioritize Improvements by Business Impact
Not every gap deserves the same level of attention. Once the root causes are clear, the real question is where to focus first.
Prioritization should be based on business impact. Which gaps create the biggest cost or risk exposure? Which root causes are systemic rather than one-off? A rare issue caused by an unusual site condition is not the same as a recurring estimating problem that appears across several projects.
The U.S. Department of Energy frames this stage as action plan development, with root-cause analysis feeding directly into corrective action. The point is to turn findings into specific priorities, not just generate a list of observations.
A simple way to evaluate each root cause is to look at two things:
- Frequency: Does this issue show up consistently across projects or project phases?
- Magnitude: When it happens, how much does it affect cost or quality?
Issues that score high on both should rise to the top of the improvement list. Issues that are rare and low-impact can be tracked without pulling resources away from more important problems.
This kind of prioritization also makes it easier to justify process changes. When an improvement is tied to a documented gap and a measurable impact, it is much easier to get buy in and allocate the right resources. Tools like Nomitech’s estimating and benchmarking software can support that process by keeping the data organized, comparable, and easier to act on. If the project is using detailed estimate structures, the Cost Breakdown Structure can also help trace variances back to specific cost categories. That makes the action plan easier to defend and more practical to execute.
Communicate Benchmark Results to Executives and Teams
Collecting benchmark data is only half the job. The other half is getting it to the right people in a format they can actually use. Whether you are presenting to a project board or sharing results with a cross-functional team, the way you communicate benchmark findings has a direct impact on how much trust they get and how quickly they lead to action.
Make Benchmark Metrics Transparent and Actionable
Transparency is the starting point for any benchmarking process that people can trust. If stakeholders can see how the metric was defined, where the data came from, and how the conclusion was reached, they are much more likely to use it in decision-making.
That means going beyond the raw number. For each benchmark metric, document:
- What it measures and why it was selected
- The data source and collection method
- The baseline or reference point used for comparison
- What a good, acceptable, or poor result looks like in context
Actionability matters just as much. A metric that highlights a problem but offers no path forward tends to create frustration, not progress. Each finding should point to a next step, whether that means adjusting a process, shifting resources, or digging deeper into a specific cost driver.
For technical teams, this level of detail also makes peer review easier. Engineers and estimators can check the logic behind a benchmark, spot issues early, and improve the method over time. That kind of review can also support internal benchmarking efforts by making sure teams compare like with like.
Use Dashboards and Templates for Consistent Reporting
Consistency matters when benchmark results need to be reviewed across multiple projects or reporting periods. If every report is laid out differently, uses different units, or hides key numbers in different places, decision-makers spend time figuring out the format instead of focusing on the result.
Dashboards and standardized reporting templates solve that problem by giving everyone a familiar structure. A well-designed benchmark dashboard typically includes:
- A summary view with high-level KPIs at a glance
- Trend lines that show performance over time, not just point-in-time snapshots
- Drill-down capability for teams who need the underlying detail
- Clear visual cues that flag areas outside acceptable ranges
Standardized templates can also place key takeaways at the top so executives see the main benchmark message first.
Templates do the same thing for written reports. When the structure stays consistent, reviewers know exactly where to find cost variance data or carbon-intensity comparisons. That reduces friction and speeds up the review cycle.
Tools like CostOS from Nomitech support this kind of structured output by helping estimating teams generate reports tied directly to benchmark data, so the numbers stay traceable from the estimate through to the final comparison.
Connect Benchmark Findings to Leadership Decisions
Executives do not need every detail of how a benchmark was built. They need a clear link between the findings and the decisions those findings should shape.
When you present benchmark results to leadership, organize the story around decisions, not data tables. Instead of opening with variance figures, start with the question the data helps answer. For example:
- Should this project move to the next phase given its current cost trajectory?
- Does this project’s carbon intensity sit within the expected benchmark range?
- Are scope changes driving the variance, or is the original estimate the real problem?
When each decision point is backed by benchmark evidence, the conversation becomes more focused and the governance process is easier to defend. If leadership can trace a go or no-go recommendation back to consistent, comparable data, approvals tend to move faster and accountability becomes clearer.
It also helps to match the level of detail to the audience. Project controls teams may need the full benchmark breakdown, while a steering committee may only need a one-page summary with key risks and recommended actions. Building that tiered reporting approach into the process from the start makes sure the right message reaches the right people without extra work at the end of each reporting cycle. For more formal reporting workflows, Nomitech case studies show how teams have standardized outputs across projects and stakeholders.
Frequently Asked Questions
What is project benchmarking for a new project?
Project benchmarking means measuring a project’s expected or actual performance against a defined reference point. For new projects, that reference point may come from internal project history, industry standards, benchmarking databases, or comparable work from peer organizations.
When should benchmarking start in a project?
Benchmarking should start during planning, not after delivery. Early benchmarking helps teams set realistic cost, carbon, and quality targets before the project moves into full execution.
Which metrics should teams use to benchmark a new project?
Teams should focus on a small set of high-impact metrics. Common examples include cost performance index, cost variance, cost per unit, Estimate at Completion, carbon emissions per square metre, quality scores and client-satisfaction measures such as NPS.
How do historical baselines improve benchmarking?
Historical baselines help teams compare a new project against similar past work. Segmenting projects by budget, scale, complexity, and type makes those comparisons more meaningful and reduces the risk of using misleading assumptions.
How should benchmark results be communicated to leadership?
Benchmark results should be transparent, actionable, and tied to decisions. Executives need clear findings that show what the data means, what risks or gaps exist, and which actions or approvals the benchmark evidence supports.
When you do recalibrate, document why. A benchmark that gets updated quietly, without a clear record, creates confusion later and weakens the institutional knowledge you are trying to build. Version-controlled benchmark logs, even simple ones, give teams a clean audit trail. Tools like CostOS can help keep that history organized and easier to use across projects.
Embed Best Practices Into Standard Project Management Delivery
Individual projects generate a lot of performance data. The real challenge is capturing that knowledge before it disappears when the project closes and the team moves on.
Embedding benchmarking best practices into standard project delivery means building the habits and systems that turn project-level learning into organizational capability. A few practical ways to do that:
- Build benchmark templates into your project startup process. Instead of starting from scratch every time, maintain a living library of baseline templates organized by project type, scale, and geography. Teams can start with a relevant model and adjust from there, instead of rebuilding the logic each time.
- Run structured close-out reviews. At project completion, capture how final actuals compared with the original benchmarks, what drove the variances, and what the team would do differently next time. Feed those lessons directly back into the template library.
- Use consistent tooling across projects. When teams rely on different tools and formats, it becomes hard to roll up lessons at the organizational level. Standardizing the software used for estimating and cost control, whether that is dedicated cost engineering software or an integrated project controls environment, makes it much easier to spot patterns across your portfolio. Platforms such as Nomitech can support that consistency without forcing teams into a rigid workflow.
The goal is to move benchmarking from something individual teams do on their own into a shared organizational capability that improves with every project. Each job should leave the organization better equipped to benchmark the next one. That is how benchmarking supports superior performance, stronger business outcomes, and better decision making over time.
Ready to Take the Next Step?
If you’re exploring modern cost estimation platforms, check out Nomitech’s full suite or get in touch with our team to find the right fit for your workflows.





Stay Up to Date
Subscribe to our Newsletter today and receive the latest updates, trends, expert insights, and exclusive offers tailored to your specific industry.