

What Is Estimate Standardization Benchmarking?
TL;DR: Estimate standardization benchmarking means building estimates in a consistent way, then testing them against internal baselines, peer comparisons, and industry standards. Done well, it replaces guesswork with evidence, improves estimate accuracy, surfaces variances earlier, and helps teams make budget and project decisions with more confidence.
What Estimate Standardization Benchmarking Means
When estimates are built in different spreadsheets, with different assumptions, scope boundaries, and cost definitions, teams end up arguing about the numbers instead of trusting them. Finance, operations, and project leaders know how this plays out. Budgets get harder to defend, bids get tighter, and small inconsistencies have a way of turning into major cost surprises later on.
That is why estimate standardization benchmarking matters more now than it used to. As portfolios grow and data gets scattered across teams, systems, and regions, it becomes much harder to tell whether an estimate is realistic, competitive, or quietly drifting away from actual performance. Teams need a way to bring some order to the process and test decisions against something stronger than instinct.
Estimate standardization benchmarking gives them that structure. It creates a repeatable way to build estimates, then checks those estimates against defined baselines so organizations can spot risk earlier, strengthen governance, and improve decisions over time. In other words, standardization and benchmarking are often treated like separate tasks, but they work far better together.
Standardization makes sure estimates use the same inputs, methods, and definitions across teams and projects. Benchmarking adds the internal and external reference points needed to judge whether those estimates are realistic, competitive, or drifting away from actual results.
Put the two together, and finance, operations, and project teams get an estimating process that is easier to defend, repeat, and improve over time.
A Working Definition for Finance, Operations, and Project Leaders
At a practical level, estimate standardization benchmarking means moving away from assumption-heavy estimating and toward a process grounded in historical performance and structured comparison. Instead of rebuilding every estimate from scratch, teams create baselines from what has actually happened, then use those baselines to set more realistic expectations for the next job.
Benchmarking, in the broader business sense, is the process of measuring products, services, and processes against those of organizations known to be leaders in one or more aspects of their operations. That matters here because estimates are not just numbers. They are management tools used to measure performance, determine budget realism, and compare expected value against past performance and market conditions.
monday.com explains this clearly in a project management context. Benchmarking creates objective performance baselines from historical data, which helps replace wishful thinking in estimates for timelines, budgets, and resources. One example they share is marketing teams using past data to show that campaign assets usually take 15 days to deliver. That simple baseline helps stop unrealistic commitments before they start.
The same logic applies directly to capital project estimating. If your team has a documented baseline for what a given scope of work typically costs, or how long it usually takes, your estimates are based on evidence instead of optimism.
For project and operations leaders, that matters because:
- Estimates are easier to audit and defend
- Variances stand out sooner and are easier to explain
- Planning moves faster when baselines are already in place
- Stakeholders have more confidence when estimates follow a consistent structure
How Standardization and Benchmarking Work Together
Standardization on its own gives teams consistency, but not proof that the output is accurate. Benchmarking on its own gives you comparison points, but those comparisons fall apart quickly if estimates were built with different assumptions, definitions, or scope boundaries. One without the other leaves a gap.
A benchmark is really a standard reference point used to measure and compare performance, quality, or process outcomes. A good benchmark is transparent, relevant, and tied to the performance metrics that matter most to the business. Without clear definitions and comparable data, even a well-intended benchmark can distort decisions rather than improve them.
The Pedowitz Group describes a three-tier benchmarking model that makes this clear. The first tier is an internal baseline built from 12 to 18 months of historical trends. The second is a peer cohort comparison matched by company size and sales motion. The third uses broader industry standards from credible external studies.
That layered view gives teams a fuller way to judge an estimate. Something may look reasonable against internal history but still sit outside the range peers are achieving. Or it may fit internal norms while falling short of broader industry benchmarks, which often signals that performance or estimating assumptions need a closer look.
For any of those comparisons to mean much, the underlying data has to be normalized. The Pedowitz Group points out the need to align definitions and account for differences in mix and region before drawing conclusions. That is where standardization becomes essential. If your estimating logic does not line up with the logic behind the benchmark data, the comparison is weak from day one.
Once those baselines are in place across all three tiers, teams can set targets in structured ranges such as P50, P75, and P90. Those targets can then feed directly into OKRs, capital planning, and budget development. In practice, this is also where benchmarking software and cost benchmarking tools can help by keeping methods, classifications, and benchmark references aligned across the workflow.
The result is an estimating framework that is internally consistent and externally calibrated. For project and finance leaders, that means a much clearer read on where estimates stand, where risk is building, and where improvement is needed.
Why Decision-Makers Use It
Estimate standardization benchmarking is not just an estimator’s exercise. It shapes how leaders build budgets, set performance targets, and speak with confidence to boards, clients, and internal stakeholders. When estimates come from structured, comparable data instead of individual judgment alone, the entire decision process gets stronger.
That is why leaders across capital projects, operations, and commercial teams are putting more weight on it.
Replacing Guesswork With Evidence-Based Planning
One of the biggest problems in project planning is simple: estimates often reflect optimism more than proof. Teams build timelines and budgets around what they hope to achieve, not just what past performance and project data say is realistic.
Benchmarking changes that. It creates objective baselines from actual project data. As monday.com notes, historical data helps teams set more realistic expectations for time, cost, and resources. Instead of leaning on best-case assumptions, they work from figures they can actually support.
This matters most when estimates drive high-impact decisions like project approvals, contract strategy, or portfolio-level resource planning. If the numbers are grounded in what has happened before, decision-makers can move ahead with a lot more confidence than they ever could with gut-feel estimates.
This is also where structured estimating systems start proving their value. Cost estimating software makes it easier to compare estimates across projects, teams, and regions, so planning is based on a consistent view of performance rather than scattered spreadsheets and individual judgment.
Supporting Better Budgets, Targets, and Executive Confidence
Beyond the project level, estimate standardization benchmarking gives leadership a practical framework for setting budgets, financial targets, and performance expectations.
The Pedowitz Group describes a useful three-tier approach. Start with an internal baseline using 12 to 18 months of your own results. Then add peer data based on company size and operating model. Finally, bring in broader industry benchmarks from credible external studies. That layered view helps organizations see three things at once: how they are performing against their own history, against comparable companies, and against the wider market.
It also improves how targets are set. Instead of picking one number and hoping it holds, teams can define performance ranges tied to different confidence levels. That gives leadership a more honest picture of what is likely, what is possible, and where risk starts to climb.
When estimates are built around this kind of benchmark structure, budget discussions usually change tone. They become less defensive and more productive. Executives walk into board reviews and stakeholder meetings with numbers they can explain clearly, not figures they have to defend under pressure. Often, that shift in confidence is what helps a project move forward instead of stalling.
The Core Framework: Baselines, Peer Sets, and Industry Standards
Good estimate standardization benchmarking does not come from a single reference point. It works best as a layered model that starts internally, then moves outward. First, you ground the process in your own historical data. Next, you compare against the right peer group. Finally, you check those findings against broader industry standards. Each layer adds context the others cannot.
That three-tier structure gives teams a practical way to tell whether an estimate reflects real performance or just old assumptions carried forward from past projects.
Internal Baselines From Recent Historical Performance
Before you compare yourself to anyone else, you need a clear view of your own starting point. That means building an internal baseline from recent project data.
According to Pedowitz Group, a useful benchmark window is 12 to 18 months of historical trends. That is usually long enough to smooth out one-off noise while still reflecting how the business actually operates today.
A few things matter here:
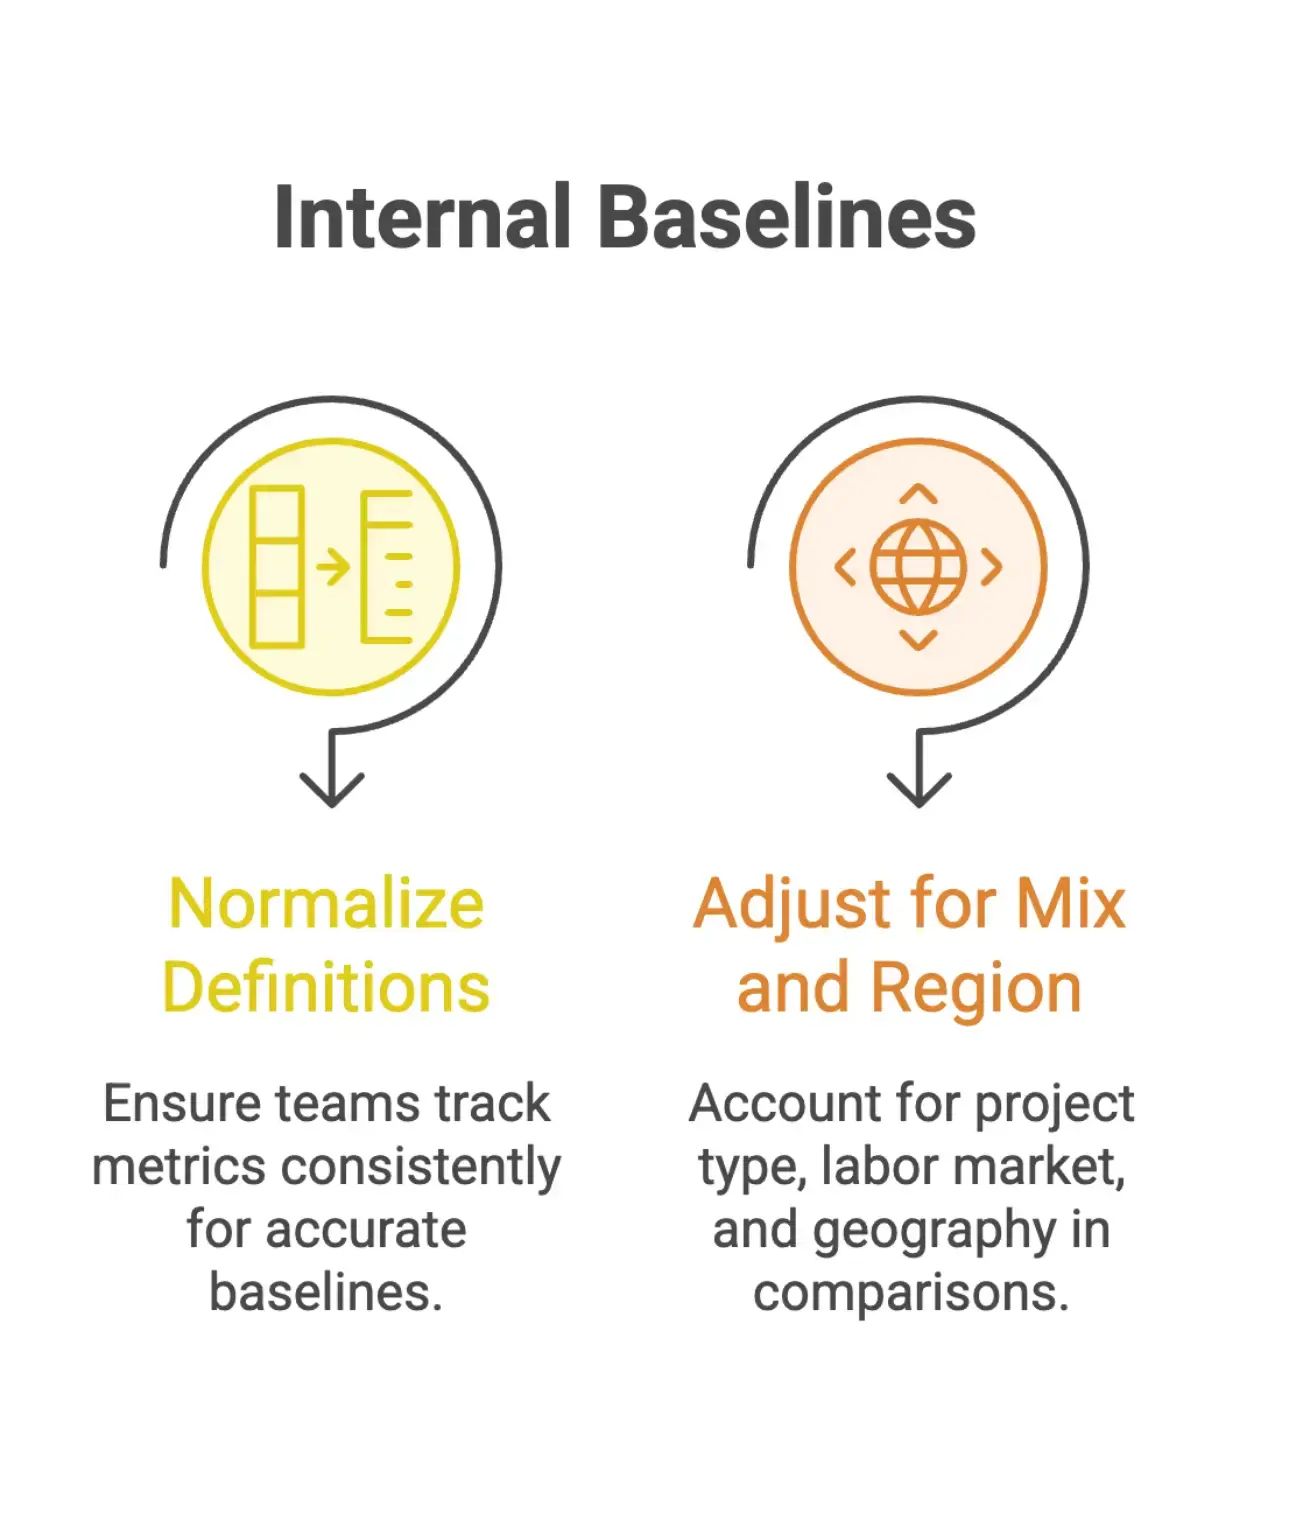
- Normalize your definitions. If teams track the same metric in different ways, the baseline is off before external benchmarking even starts.
- Adjust for mix and region. Project type, labor market, and geography all affect cost behavior. Ignore those factors, and every comparison that follows gets weaker.
Your internal baseline is not the target. It is the factual starting point. In tools like a centralized cost estimating database, this is often where teams begin cleaning historical cost data so later comparisons are actually meaningful.
A lot of organizations make the mistake of treating internal history as enough on its own. It is not. Internal numbers are useful, but they can also normalize weak habits. That is why strong benchmarking programs use internal baselines as a starting point, not the finish line.
Peer Cohorts and Comparable Data for More Relevant Comparisons
Once the internal baseline is in place, the next step is comparing against companies that genuinely look like yours. That is where peer cohort benchmarking becomes useful.
Pedowitz Group recommends segmenting peer groups by company size and sales motion so the comparison reflects similar operating models. A small regional contractor and a global EPC may both build complex projects, but comparing them side by side rarely leads to insight you can use.
A well-defined comparison group is crucial because the value of any benchmark depends on relevance. If peer groups do not reflect similar organization size, delivery conditions, and business context, the resulting data can be technically correct but practically unhelpful. In other words, a good benchmark depends as much on the comparison group as on the number itself.
Peer comparisons are often more valuable than broad industry averages because they show performance gaps in context. If your estimate accuracy, contingency levels, or labor assumptions differ from peer organizations with similar scope and delivery conditions, you have a much stronger reason to dig into what is driving the gap.
This is the question most estimating teams actually care about: How are we doing compared with organizations doing similar work under similar conditions?
Industry Standards and Benchmarking Studies as an External Reality Check
The third layer widens the lens. Industry standards from credible external studies give you a reality check on what your internal data and peer comparisons are telling you.
Pedowitz Group describes this as the outer validation layer in the framework. Instead of relying on internal reporting alone, teams use established research to define structured target ranges across percentiles such as P50, P75, and P90. That makes OKRs, estimate reviews, and budget thresholds easier to defend.
This kind of external validation is not just a private-sector practice. The Bureau of Labor Statistics uses the same basic idea at a national level, reconciling employment estimates each year against comprehensive payroll counts across all 50 states, Washington D.C., and more than 430 metropolitan areas. The principle is straightforward. Use a broader, more complete dataset to validate working estimates and correct them when needed.
For estimating teams, this outer layer keeps internal benchmarks from becoming self-referential. Without it, weak performance can start to look normal simply because the organization has gotten used to it. A more disciplined process, supported by structured benchmarking and cost benchmarking tools, helps keep those standards honest.
Regular benchmarking studies also do more than validate a number. They help organizations identify weaknesses, address inefficiencies, and develop innovative strategies for staying ahead in changing market conditions. When benchmarking studies are repeated over time, they become part of continuous improvement instead of a one-off comparison exercise.
How to Standardize Estimates Before Benchmarking
Benchmarking only works when the comparison is fair. Before you line up an estimate against internal history or outside market data, you need to standardize the inputs. That means getting scopes, definitions, delivery methods, locations, and complexity levels onto the same footing. Skip that step, and the benchmark may look useful while quietly pushing decisions in the wrong direction.
Here is what that standardization work looks like in practice.
Normalize Definitions, Units, and Cost Categories
The first hurdle is basic. Most teams do not structure cost data the same way.
One group may roll indirects into labor. Another may separate them. Some estimates are in current-year dollars. Others still reflect older pricing with no escalation applied. Those gaps create noise, and that noise makes it hard to tell whether you are seeing a real cost difference or just inconsistent data.
Before you compare anything, align these basics:
- Cost category definitions so labor, materials, equipment, and overhead are treated the same way across every data set
- Units of measure so metrics like cost per unit, cost per system, or cost per deliverable are calculated consistently
- Time periods and escalation adjustments so you are not comparing 2019 pricing with 2024 pricing as if they were the same thing
According to Pedowitz Group, a solid benchmarking process starts with an internal baseline built from 12 to 18 months of historical trends before expanding to peer groups and industry standards. That order matters. Your own data is the first benchmark, and it needs to be clean and consistently defined before it can support any broader comparison.
The same goes for target ranges such as P50, P75, and P90. Those only mean something if the underlying data has already been normalized. Otherwise, the percentile labels sound precise, but they are not telling you much.
This is where standardization benchmarking provides real value. It gives teams a consistent framework using standardized key performance indicators and clear definitions so they can compare performance levels across business units, regions, or companies using the same data logic.
Use a Comparability Checklist to Match the Right Projects
A common benchmarking mistake is using projects that look similar at a glance but are actually very different in the areas that drive cost. A comparability checklist helps stop that.
Vinay Raut on LinkedIn describes a checklist built around five core dimensions:
- Industry so the benchmark reflects the same sector cost drivers
- Scope so the technical and functional boundaries match
- Complexity so straightforward work is not being compared with highly complex execution
- Delivery method so Agile and Waterfall projects are not mixed together without adjustment
- Geographic cost structure so labor rates, supply costs, and local conditions are accounted for

Using this checklist before you pull benchmark data makes the comparison far more credible. It also improves variance analysis. If your estimate is running more than 30% above or 20% below the benchmark, that should trigger a closer look. But that gap only means something if the projects were genuinely comparable in the first place.
It also helps to triangulate across multiple sources. Internal historical data, industry databases, vendor quotes, and peer inputs all add perspective. As Vinay Raut notes, no single source gives you the full picture.
For teams managing this inside a structured estimating workflow, this is often where estimate classification and benchmarking with historical cost data become especially useful. Cost estimating software can support that consistency, but the principle is bigger than any single system. Good benchmarking starts with disciplined data selection.
Adjust for Mix, Region, and Delivery Method
Even after you have matched projects carefully, some differences still need to be adjusted directly. Three areas usually matter most.
Mix adjustments deal with how the work is distributed. Two projects may have the same overall cost and still be built very differently. One may lean heavily on engineering hours, while another carries more procurement or field labor. If the work mix changes, a straight cost comparison can give you the wrong answer.
Regional adjustments reflect a basic reality of project work. Labor rates, material pricing, logistics, taxes, and regulatory requirements all vary by location. A benchmark from one region cannot simply be dropped onto another without applying the right location factor or cost index.
Delivery method adjustments matter because Agile and Waterfall do not behave the same way from a cost standpoint. As highlighted by Vinay Raut on LinkedIn, delivery method is a required matching criterion because it changes how costs appear, when they are incurred, and how risk is distributed through the project lifecycle.
Pedowitz Group makes the same point. Normalizing for mix and region is not a nice extra step. It is part of building a benchmark you can actually trust.
When teams take the time to work through these adjustments, benchmark gaps become much more useful. If an estimate still sits outside the expected range, you are more likely looking at a real cost driver, not just a data quality problem.
Benchmarking Data, Inputs, and the Full Benchmarking Process
Reliable benchmarking never comes from one source alone. Teams that produce accurate, defensible estimates pull data from several places, then check those inputs against each other. In practice, that means combining internal records with outside references, layering in current vendor pricing, and validating the picture with credible public or industry data.
A strong benchmarking process is systematic and data-driven. Most effective programs follow four basic steps: planning, data collection, analysis, and implementation. In practical terms, teams define the scope and metrics first, collect data from internal and external sources, analyze the gaps, and then turn the findings into action plans for improvement.
Here is a closer look at the benchmark inputs that matter most and how each one strengthens estimate validation.
Internal Databases and Historical Trend Lines
Your own project history is usually the best place to start. It reflects your real cost structure, how your teams actually deliver work, and the regional conditions you deal with every day.
According to Pedowitz Group, strong benchmarking frameworks typically begin with an internal baseline built from 12 to 18 months of historical performance data. That is long enough to smooth out unusual spikes or one-off events, but recent enough to stay useful in a changing cost environment.
From that baseline, organizations can:
- Set realistic cost ranges by project type
- Track internal cost movement over time
- Define performance targets with ranges such as P50, P75, and P90 for OKRs and budget planning

The part that often gets overlooked is consistency. Before comparing this quarter to last year, you need to know scope, cost categories, and delivery metrics were captured the same way each time. If those definitions shift from project to project, the trend line stops meaning much no matter how much data you have.
This is also where structured estimating systems can help. Tools supported by a centralized cost estimating database are useful when teams need a more consistent way to classify, store, and reuse historical data across projects.
Teams also need to collect data in a disciplined way. Generating reliable data is time-consuming, and it often requires defined metrics, quality checks, and a clear sample size large enough to support meaningful comparison.
Industry Databases, Vendor Quotes, and Peer Networks
Once your internal baseline is in place, external inputs add market context. They help you test whether your numbers are realistic, competitive, and aligned with what similar work is actually costing elsewhere.
Vinay Raut on LinkedIn describes a triangulation approach built around four sources: industry databases, vendor quotes, peer networks, and internal records. The logic is simple. Any one source can be incomplete, outdated, or biased. When several sources point in the same direction, confidence goes up.
That said, not every external comparison is useful. Raut’s framework includes a comparability checklist to make sure benchmark data lines up on the factors that matter most:
- Industry and sector
- Project scope and complexity
- Delivery method, whether Agile, Waterfall, or another model
- Geographic cost structure
Skip that step, and the benchmark can do more harm than good. A software rollout for a large North American enterprise is not a meaningful reference for a mid-market implementation in Southeast Asia, even if the underlying system is the same.
Variance matters too. If an estimate comes in more than 30% above or more than 20% below the benchmark, Raut recommends investigating why. Gaps at that level usually point to real cost drivers, not just normal estimating noise. It could be labor availability, procurement strategy, schedule pressure, or scope hidden in the details.
Some organizations also access benchmarking data through peer groups, industry associations, surveys, and focus groups. Those channels can be useful, especially when formal published sources are thin, but they still need careful screening for quality, consistency, and relevance.
Public Statistical Benchmarks and Why They Matter
Public datasets add something different. They bring scale, consistency, and a level of standardization that most organizations cannot build on their own.
A good example is the Bureau of Labor Statistics, which each year benchmarks its Current Employment Statistics estimates against the Quarterly Census of Employment and Wages. That process covers all 50 states, Washington D.C., Puerto Rico, the U.S. Virgin Islands, and 430 metropolitan areas. Preliminary benchmark revisions for March 2025 are scheduled for publication on September 9, 2025, with final figures incorporated into the January 2026 release.
That kind of large-scale recalibration is exactly why public statistical data works well as a reference layer. It is regularly reviewed, geographically detailed, and updated on a known schedule.
For estimators and project controls teams, public benchmarks play two practical roles:
- They offer a neutral reference when internal data or supplier pricing looks distorted
- They support regional cost adjustment, especially on labor-heavy projects where location changes the numbers quickly
The best benchmarking programs do not use public statistics as the main input. They use them as a validation layer. If your internal data, supplier quotes, and market benchmarks all point in a similar direction, you can move ahead with a lot more confidence.
Methods for Evaluating Estimate Accuracy and Maturity
Finishing an estimate is only part of the job. The harder question is whether anyone should trust it. In capital projects, that distinction matters. A structured way to judge estimate quality before the project moves ahead is what separates sound decisions from expensive assumptions.
The methods below give teams a practical way to assess estimate reliability at each stage of project development.
Estimate Maturity and Classification Frameworks
Not every estimate carries the same level of confidence. Treating them as if they do is a fast way to create unrealistic expectations and, sooner or later, budget overruns. Estimate maturity frameworks solve that by showing where an estimate sits, from an early conceptual number to a detailed, risk-adjusted forecast.
CAF Corporation offers a useful example through its Kpex tool, which includes a Cost Estimate Accuracy Assessment Tool based on AACE International standards. It looks at estimates through three connected lenses: maturity, classification, and risk. That matters because estimate accuracy is not a simple pass-or-fail issue. It depends heavily on how much of the project is actually defined when the estimate is prepared.
Maturity models help measure the sophistication of an organization’s estimating processes against a structured model. In practice, that gives teams more detail about whether the issue is weak scope definition, inconsistent methods, poor data quality, or underdeveloped governance.
For early-phase work, this kind of structure is especially helpful. It gives stakeholders a more realistic sense of what the number actually means, highlights where scope still needs work before money is committed, and makes sure estimates are judged against others at the same stage of development, not against fully engineered projects.
Key benefits of using a maturity and classification framework include:
- Clearer communication between estimators, project managers, and leadership about what the estimate can and cannot support
- A consistent internal standard for defining Class 1, Class 2, or Class 5 estimates
- A stronger basis for risk-adjusted review instead of relying on one-time accuracy checks
Using P50, P75, and P90 Ranges for Planning Confidence
One of the best ways to move past single-point estimates is to present cost and schedule as probability ranges. That gives decision-makers real context instead of forcing everything onto one number that may not survive execution.
The Pedowitz Group outlines a benchmarking model built around P50, P75, and P90 ranges, and the logic carries over well into budgeting and OKR planning. In simple terms, P50 is the midpoint outcome, P75 reflects a stronger planning threshold, and P90 represents a high-confidence upper range. Used together, these levels help teams plan with more discipline while still leaving room for stretch targets.
Of course, percentile ranges only mean something if the underlying data is comparable. The same benchmarking approach stresses the need to normalize definitions across data sources, account for regional differences and company size, and build the baseline from credible internal and external data. Skip that step, and the ranges can become misleading fast, especially when comparing projects across different locations or contracting strategies.
In many cases, teams assume these percentiles follow a normal distribution. Real project cost outcomes do not always behave that neatly, so it is important to test the distribution of the data before using percentile labels as if they were statistically interchangeable. The normal distribution can still be a useful reference, but only when the underlying data supports it.
For estimating teams, adding P50 to P90 ranges to standard deliverables changes the boardroom discussion. The question stops being "is this estimate right?" and becomes "how much confidence do we need before we move?" That is a far more useful way to think about planning and risk.
Gate Reviews and Go/No-Go Decisions
Stage-gate reviews are where estimate quality gets tested for real. Whether the gate is project sanction, EPC award, or funding approval, the estimate needs to hold up against actual market and project performance, not just internal assumptions.
CAF Corporation addresses this through gate-assurance benchmarking in Kpex, which compares proposed estimates with realized results from similar projects at the same decision point. So when a team brings forward a sanction estimate, it can be checked against what peer projects actually cost at that same gate. That gives reviewers an external reference grounded in reality, not just an internal loop of validation.
The tool also supports early go and no-go decisions with concept-screening metrics based on industry performance data. That gives teams cost and schedule signals before detailed engineering is underway. In practice, it means weaker concepts can be screened out earlier, before significant time and budget are tied up.
Effective gate reviews supported by benchmarking data typically address:
- Whether the estimate matches the expected level of project definition for the current phase
- How the proposed cost and schedule compare with peer-project outcomes at the same gate
- Which risk factors could push the estimate outside the accepted confidence range before the next decision point
When teams combine maturity classification, probabilistic ranges, and gate-level benchmarking in one review process, they get a much clearer picture of estimate reliability than any single metric can provide on its own.
Variance Analysis: Finding Cost Drivers and Risk Signals
Benchmarking does more than tell you whether an estimate sits in the right range. Used properly, it shows why the number is off, and that is the part that really matters. An estimate that lands 25% above benchmark might reflect real project complexity. Or it might point to a scope miss, the wrong delivery model, or a legacy cost structure nobody has challenged in years. If teams skip that analysis, those gaps get waved through, and that is often where overruns and schedule trouble begin.
The real value of benchmarking is not the comparison alone. It is the conversation that comparison forces the team to have.
Thresholds That Trigger Review and Escalation
Not every variance needs a full investigation. Small gaps are normal. No two projects are exactly alike, and estimating always involves some uncertainty. The real question is simple: which differences are just noise, and which ones deserve attention?
According to Vinay Raut on LinkedIn, one practical method is to set clear deviation thresholds that automatically trigger a review. If an estimate comes in more than 30% above benchmark or more than 20% below it, that should lead to a structured check of the underlying cost drivers instead of a quick sign-off.
Those thresholds matter because the risks are not equal. If the estimate is too high, you may lose the bid or tie up contingency where it is not needed. If it is too low, the risk is usually worse. You move forward on a budget that was never realistic to begin with.
In day-to-day estimating work, defined thresholds help in a few important ways:
- They take subjectivity out of escalation. Instead of depending on one estimator’s judgment, the team works to a consistent standard.
- They create an audit trail. Each review leaves behind a record that can strengthen future benchmarks and improve internal estimating practices.
- They push intervention earlier. Finding a weak estimate before detailed design or procurement is far less painful than fixing it later.
The point is not to punish estimates that differ from benchmark data. It is to make sure any major deviation is understood, explainable, and defensible before the project is locked in. Tools that support variance analysis in projects can make those reviews easier to standardize across teams and portfolios.
Diagnosing Scope, Complexity, and Location Effects
Once a variance crosses the review threshold, the next step is figuring out what is actually driving it. That only works if the benchmark is truly comparable to the project being estimated.
Vinay Raut points to a straightforward comparability checklist built around four factors: industry, scope, complexity, delivery method such as Agile or Waterfall, and geographic cost structure. If those factors do not line up, the variance may be telling you more about structural differences than about a mistake in the estimate.
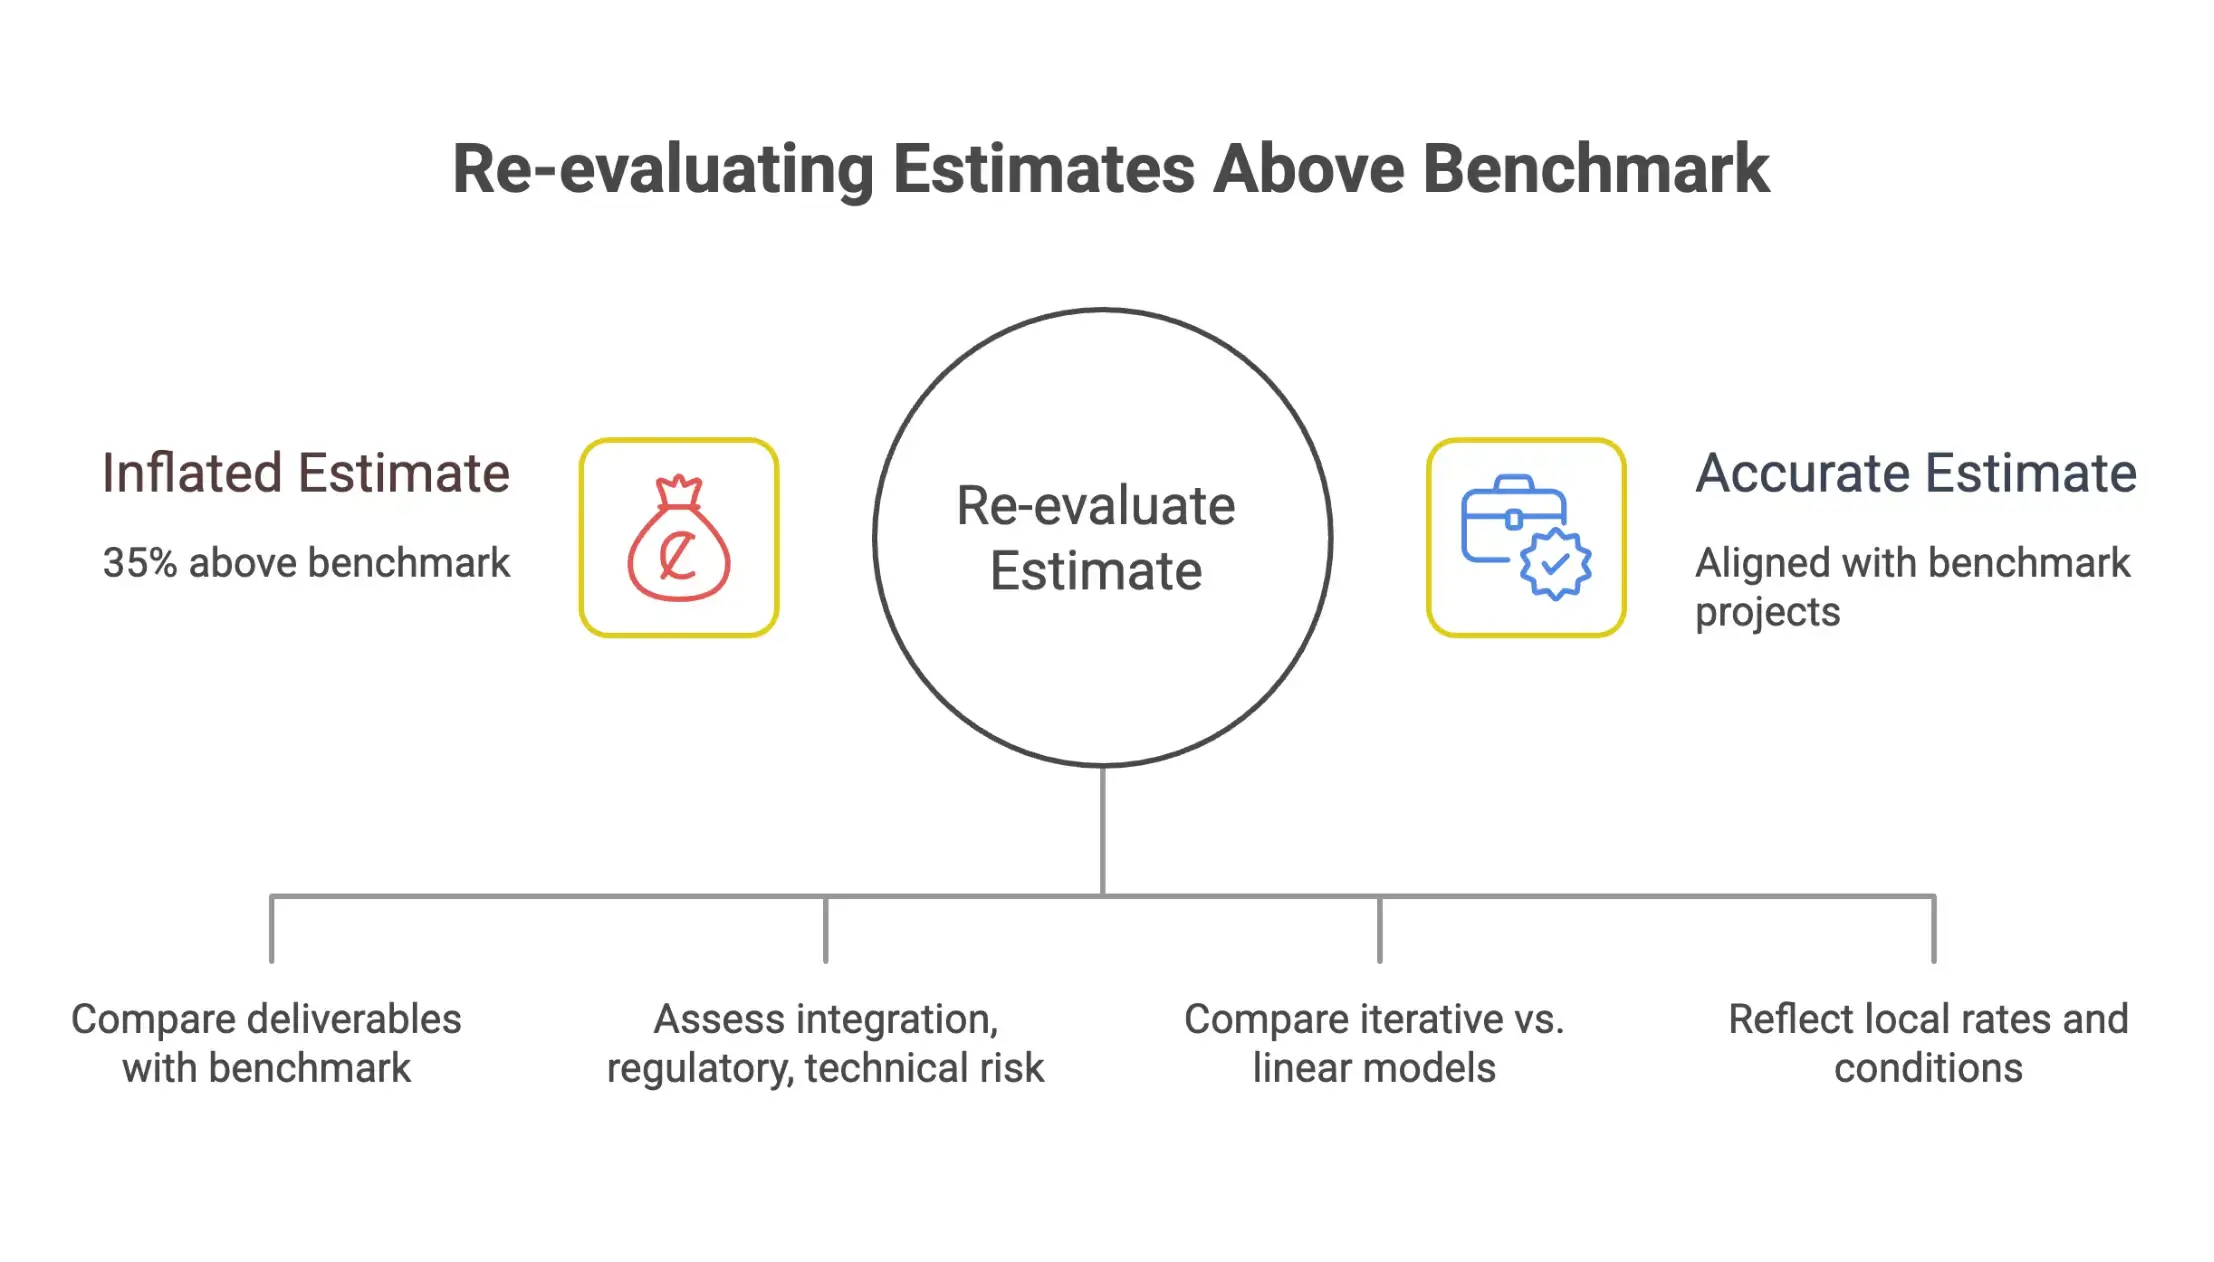
That is a critical distinction when teams start root-cause analysis. Say an estimate comes in 35% above benchmark. Before anyone labels it inflated, the team should stop and ask:
- Is the scope really aligned with the benchmark projects, or does this job include extra deliverables the others did not?
- Is the complexity level comparable, including integration needs, regulatory constraints, or technical risk?
- Is the delivery method the same? An iterative delivery model can carry a very different cost profile from a linear one.
- Does the location adjustment reflect local labor rates, logistics, and current regional market conditions?
If the benchmark projects came from another region or followed a different delivery approach, the variance may not be a problem at all. It may just be a poor comparison.
That is also why Vinay Raut recommends triangulating across multiple sources: internal project history, industry databases, vendor quotes, and peer networks. That approach is often more reliable than leaning on a single benchmark. When several independent sources point to a similar range and the estimate still sits well outside it, the signal gets much stronger. In practice, this is where benchmarking with historical cost data can add real value.
Scope, complexity, and location are not just boxes to tick during benchmarking. They are active cost drivers. Understanding how each one shapes a specific estimate is what turns benchmarking from a reporting exercise into a practical way to improve estimating accuracy over time.
Technical Benchmarking, Competitive Benchmarking, and Other Methods
Not all benchmarking serves the same purpose. Teams often talk about benchmarking as if it were one method, but in practice there are several forms, each suited to different decisions.
Technical benchmarking focuses on comparing the capabilities, characteristics, or outputs of products and services. In estimating, technical benchmarking is useful when teams need to compare unit rates, system performance, engineering intensity, or asset classes across similar facilities. Technical benchmarking can also help determine whether a project design is carrying unnecessary cost because it exceeds what leading organizations typically require. For infrastructure projects and industrial systems, technical benchmarking often sits alongside cost analysis because design choices and technical standards directly affect value.
Competitive benchmarking is narrower. It looks at how an organization performs against direct competitors in the same market. That can help in bid strategy, pricing, schedule expectations, and commercial positioning, but it should not be the only method because direct competitors are not always the source of best practices.
There is also strategic benchmarking, which looks beyond immediate competitors to leading organizations in other sectors. That can sound abstract, but it often reveals useful practices in procurement, quality control, or digital workflow design that can improve business performance even when the underlying industry is different.
In practical estimating work, the main methods usually include internal data comparison, external competitive analysis, and generic or strategic benchmarking. Together, these approaches help organizations determine what good looks like from several angles instead of relying on one narrow benchmark.
Industry Applications, Case Studies, and Use Cases
Estimate standardization benchmarking is not tied to one industry. It shows up in very different settings, from project teams planning delivery schedules to public agencies validating national employment figures. The common thread is simple: estimates get stronger when they are tested against trusted reference points instead of relying on instinct.
Here is what that looks like across three very different environments.
Project Management Teams Building Realistic Delivery Plans
A common problem in project management is that timelines and budgets are built on optimism instead of evidence. Teams commit to dates that sound reasonable in a planning meeting, but those dates may have little to do with how similar work has actually performed.
Benchmarking brings discipline to that process. According to monday.com, effective project benchmarking replaces guesswork with objective baselines drawn from historical performance. Those baselines can shape schedules, budgets, and resource plans, giving teams something concrete to work from.
The same source gives a useful example. A marketing team might know from past work that campaign asset delivery typically takes about 15 days. That benchmark immediately improves planning. It keeps the team from promising a five-day turnaround when there is no real precedent for it.
For project teams, the benefits are practical and easy to see. Standardized benchmarks can:
- Reduce scope creep caused by timelines that were too aggressive from the start
- Align expectations across teams, clients, and leadership
- Make staffing and resource decisions easier to justify
This is also where structured estimating tools become useful. Teams using cost estimating software can bring historical benchmarks, estimating logic, and delivery assumptions into one workflow instead of managing them across disconnected spreadsheets.
Capital Projects Using Stage-Gate and Peer Performance Benchmarks
In capital-intensive sectors like energy, infrastructure, and industrial construction, weak estimates at decision gates can create serious financial risk. A project may look attractive during concept screening, then unravel later when the numbers are stress-tested in detail. Usually, the root issue is the same: the early estimate was never anchored to a credible benchmark.
CAF Corporation outlines one approach through its Kpex platform, which includes a Cost Estimate Accuracy Assessment Tool based on AACE International standards. The tool reviews estimate maturity, classification, and risk exposure so teams can judge how dependable an estimate really is at each project stage.
That matters most in the early phases. Concept screening works better when cost and schedule indicators are based on actual industry performance, not rough assumptions. Benchmark data gives decision-makers a clearer view of whether a project deserves more time, money, and engineering effort.
Later in the lifecycle, gate assurance takes that one step further. Proposed estimates are compared with the actual outcomes of peer projects at key milestones such as sanction or EPC contract award. That creates a much stronger test. The question is no longer whether the estimate looks internally consistent. It is whether it stands up against what comparable projects have really delivered.
For capital project teams, this staged benchmarking approach supports better decisions at every gate. It also lowers the chance of moving ahead with cost assumptions that were flawed from the beginning.
For organizations running formal estimating workflows, this is often where integrated systems add value. A tool like benchmarking software can support estimate classification, benchmark alignment, and stage-based review without turning the process into an administrative burden.
Public Data Programs Validating Estimates Against Census-Level Counts
Benchmarking estimates is not just a commercial project practice. Public statistical programs deal with the same question: how do you know an estimate is accurate enough to publish with confidence?
The Bureau of Labor Statistics offers a clear example through its Current Employment Statistics program. CES employment estimates are benchmarked each year against Quarterly Census of Employment and Wages counts. Those counts serve as a broad reference base covering all 50 states, the District of Columbia, Puerto Rico, the U.S. Virgin Islands, and 430 metropolitan areas.
This benchmark cycle covers data from April 2024 through September 2025. Preliminary benchmark revisions for March 2025 are scheduled for publication on September 9, 2025, and final revisions will be included in the January 2026 release.
The logic is the same one used in capital project benchmarking. A working estimate is checked against a more complete and independently derived reference set. If the two do not line up, the estimate is revised. That extra step makes the final published data far more credible because it has been tested against a known standard.
For public sector data teams, the takeaway is clear. Estimate standardization benchmarking is not only about technical accuracy. It is also about trust. When published figures are backed by a transparent validation process, users have more reason to rely on them.
How to Build an Estimate Standardization Benchmarking Program
A benchmarking program that actually shapes decisions takes more than lining up industry averages against project costs. It needs structure, clear ownership, and a process people can trust across project types, regions, and delivery models. Here is a practical way to build estimate standardization benchmarking into day-to-day project controls.
Start With Taxonomy, Definitions, and Comparable Data Rules
Before you benchmark anything, make sure you are comparing like with like. That sounds obvious, but it is where most programs break down. If one team includes contingency in "project cost" and another does not, the comparison is off before the discussion even starts.
Every strong benchmarking program starts with a shared taxonomy. That means agreed cost element definitions, clear scope boundaries, and rules for deciding when two estimates are truly comparable.
According to LinkedIn contributor Vinay Raut, cost benchmarking only works when projects are aligned across a few core dimensions. Those include:
- Industry and sector alignment
- Scope and complexity equivalency
- Delivery method, such as Agile versus Waterfall
- Geographic cost structure, accounting for regional labor and material rates

Without a checklist like this, it is easy to compare projects that look similar at a glance but involve very different work.
Once the taxonomy is in place, build a tiered baseline structure. The Pedowitz Group recommends a three-tier approach: begin with internal baselines from the last 12 to 18 months of historical performance, then add peer cohort data grouped by company size and sales motion, and finally bring in broader industry standards from reliable published studies. That gives teams more than a single reference point. It gives them context.
It also helps to define target ranges instead of aiming at one number. Using thresholds like P50, P75, and P90 gives OKRs and budgets a practical benchmark framework that reflects uncertainty, not just a fixed target. In tools supported by a centralized cost estimating database, this kind of structure can be tied directly to estimate classification and historical cost libraries, which makes the benchmark easier to apply consistently.
Plan, Collect Data, and Use Benchmarking Studies Regularly
One of the fastest ways to weaken a benchmarking program is to rely on a single source. One vendor quote, one industry report, or even your own historical database on its own is rarely enough for high-stakes estimate decisions.
Effective benchmarking methodologies start with careful planning, consistent data gathering, and process mapping. Teams need to collect data with the same rules each time, document how estimates flow through the process, and then compare results through recurring benchmarking studies. That discipline is what helps identify areas where performance is lagging and where improvement efforts should focus.
Vinay Raut recommends triangulating across multiple inputs to strengthen confidence in the result. In practice, that usually means combining internal project data, industry cost databases, direct vendor quotes, and peer network insight gathered through professional channels.
When those sources land in a similar range, your benchmark carries weight. When they do not, that gap is useful too. It tells you something needs a closer look.
Raut also outlines clear variance thresholds for escalation. If an estimate comes in more than 30% above or 20% below the benchmark, that should trigger a structured review of the cost drivers behind it. That kind of discipline turns benchmarking into more than a quick sense check. It becomes a working cost management process.
For capital projects, triangulation should also account for estimate maturity. CAF Corporation's Kpex platform uses a Cost Estimate Accuracy Assessment Tool based on AACE International standards to assess estimate maturity, classification, and risk. That matters because comparing two estimates at different stages of development can be misleading, even if the scope looks similar on paper.
Review Estimates at Key Decision Gates and Refresh Benchmarks Regularly
Benchmarking only adds value when it shows up at the points where decisions are made. That means building reviews into the project lifecycle at defined gates, not leaving them until the end.
CAF Corporation describes gate-assurance benchmarking as comparing a proposed estimate with realized peer-group performance at key approval points, including project sanction and EPC contract award. Done well, this highlights cost or schedule misalignment before major commitments are locked in.
For early-stage work, concept-screening metrics can help too. Industry performance data can provide cost and schedule signals early enough to support go or no-go decisions before detailed estimating begins. That makes benchmarking useful at the front end, where it can still change the outcome.
Just as important, the benchmark data itself has to stay current. Costs move. Labor markets tighten. Material pricing shifts. Regional conditions change. A benchmark built on stale data can push a project in the wrong direction.
Even large public institutions follow this discipline. The Bureau of Labor Statistics annually benchmarks its employment estimates against independently collected counts across all 50 states, regional territories, and hundreds of metro areas, publishing preliminary revisions before final updates. The lesson for project organizations is straightforward: if the refresh cycle is scheduled and transparent, people trust the numbers more.
For teams building or maturing a program, a practical cadence usually looks like this:
- Monthly or quarterly: Review active project estimates against current benchmarks at key milestones
- Annually: Refresh internal baselines using the latest 12 to 18 months of completed project data
- As-needed: Update peer cohort and industry benchmarks when credible new studies are released or market conditions shift materially
When benchmarking is built into governance routines, backed by executive reporting on variance trends and estimate accuracy, it stops being a side exercise. It becomes part of how the organization manages cost, risk, and decision quality over time.
Challenges, Best Practices, and What Makes a Good Benchmark
Benchmarking sounds straightforward, but building a good benchmark is harder than many teams expect. The data may be incomplete, the definitions may not line up, and the comparison group may be less relevant than it first appears.
Common challenges include data privacy constraints, inconsistent definitions, missing data, and weak process mapping. These problems make it harder to compare organizations fairly and can limit the ability to measure performance with confidence. They also make it harder to access benchmarking data from outside sources, especially when vendors or peer organizations use different reporting methods.
That is why a good benchmark needs a few core qualities. It should be transparent about sources and methods. It should be relevant to the estimate being reviewed. It should mirror the performance measures that matter to business performance and project success. And it should rest on reliable data, not just what happens to be available.
Best practices are fairly consistent across industries. Leading organizations use clear definitions, refresh their data regularly, compare against the right peer groups, and avoid trusting one study in isolation. They also treat benchmarking as a process of continuous improvement and continual improvement, not just a compliance exercise. Continuous benchmarking helps identify areas for incremental gains, supports innovation by borrowing proven practices, and makes it easier to adapt when market conditions change.
A final point is worth stressing. Benchmarks are only as valuable as their comparison integrity. If organizations are not careful about relevance, the number may look precise while offering very little decision value.
Frequently Asked Questions
What does estimate standardization benchmarking mean in simple terms?
It means building estimates using a consistent method, then checking those estimates against baselines to see whether they are realistic, accurate, and aligned with actual performance. The goal is to replace assumption-heavy estimating with a process grounded in historical data and structured comparison.
Why is standardization necessary before benchmarking?
Benchmarking only works when the comparison is fair. If teams use different cost definitions, units, scope boundaries, or escalation logic, the benchmark is weak from the start. Standardization makes sure the inputs are normalized before any comparison is made.
What sources should teams use for benchmarking estimates?
The article highlights a layered approach using internal historical data first, then peer cohort comparisons, vendor quotes, industry databases, and broader public or industry standards. Using multiple sources helps teams validate the estimate instead of relying on a single reference point.
How do teams know when a variance needs review?
A practical method cited in the article is to investigate estimates that come in more than 30% above benchmark or more than 20% below it. Those thresholds help teams spot gaps that may point to scope issues, complexity differences, delivery model effects, or location-based cost drivers.
How does estimate standardization benchmarking improve decision-making?
It helps leaders build budgets, set targets, and review projects with more confidence because the numbers are based on comparable data rather than judgment alone. It also makes estimates easier to audit, easier to explain, and more useful at key decision gates.
Conclusion
Estimate standardization benchmarking gives organizations a more disciplined way to build, test, and improve cost estimates over time. Instead of treating estimation as a one-off forecasting task, it turns it into a repeatable management process grounded in internal baselines, peer comparisons, and external validation.
That shift matters because estimate quality affects far more than the number on a page. It shapes project approvals, bidding strategy, budget confidence, risk visibility, and executive trust. When teams standardize how estimates are built, normalize the data behind them, and benchmark the result against the right reference points, they create a much stronger basis for planning and decision-making.
The most effective programs do not rely on a single benchmark or a one-time review. They combine taxonomy, comparability rules, triangulated data sources, variance thresholds, maturity frameworks, and stage-gate checks into one workflow. Done well, estimate standardization benchmarking becomes less about policing estimates and more about helping teams make better calls earlier, with fewer surprises later.
Ready to Take the Next Step?
If you’re exploring modern cost estimation platforms, check out Nomitech’s full suite or get in touch with our team to find the right fit for your workflows.





Stay Up to Date
Subscribe to our Newsletter today and receive the latest updates, trends, expert insights, and exclusive offers tailored to your specific industry.