

Cost Benchmarking in Mining: Metrics, Cost Curves & Capital
TL;DR: Mining cost benchmarking helps executives, investors, and technical teams compare mine performance, project economics, and capital efficiency across assets, peers, commodities, and regions. When cost data is normalized and reviewed consistently, benchmarking becomes a practical tool for capital allocation, financing confidence, portfolio optimization, and operational cost control.
Cost Benchmarking in Mining: What It Is and Why It Matters Now
Mining teams are not short on numbers. The harder problem is that those numbers often come from different places, follow different assumptions, and tell slightly different stories. One estimate uses one cost basis. A site report uses another. A peer comparison leaves out something important. That is how cost overruns, weak bids, and cloudy capital decisions start to creep in. Cost estimation software and structured benchmarking help bring all of that back onto common ground while supporting assessing project economics and helping control budget overruns before they grow into larger cost overruns.
That matters more than ever in the mining industry. Bids are tighter, projects are more complex, and cost data is often scattered across disconnected systems, spreadsheets, studies, and site reports. In a sector where margins can swing hard with commodity cycles, knowing where your operation sits against peers is not a nice extra. It is the starting point for better capital allocation, and the crucial role of consistent benchmarking is better decision making across complex mining projects.
Used well, cost benchmarking in mining becomes a practical decision-making tool. It helps executives, investors, and mining professionals compare mine performance, project economics, and capital efficiency across operations, peer groups, commodities, and regions. The sections below walk through the metrics, workflows, and strategic use cases that turn benchmarking from a reporting exercise into continuous improvement.
Defining Mining Cost Benchmarking for Executives and Investors
At its simplest, cost benchmarking is the structured comparison of a mine’s financial and operational metrics against external reference points. Those reference points might be industry averages, commodity-specific datasets, regional benchmarks, or the disclosed financial results of peer mining companies.
For executives, it answers a direct question: how does this operation really compare?
For investors, the question is even sharper: is this asset competitive today, and can it stay that way?
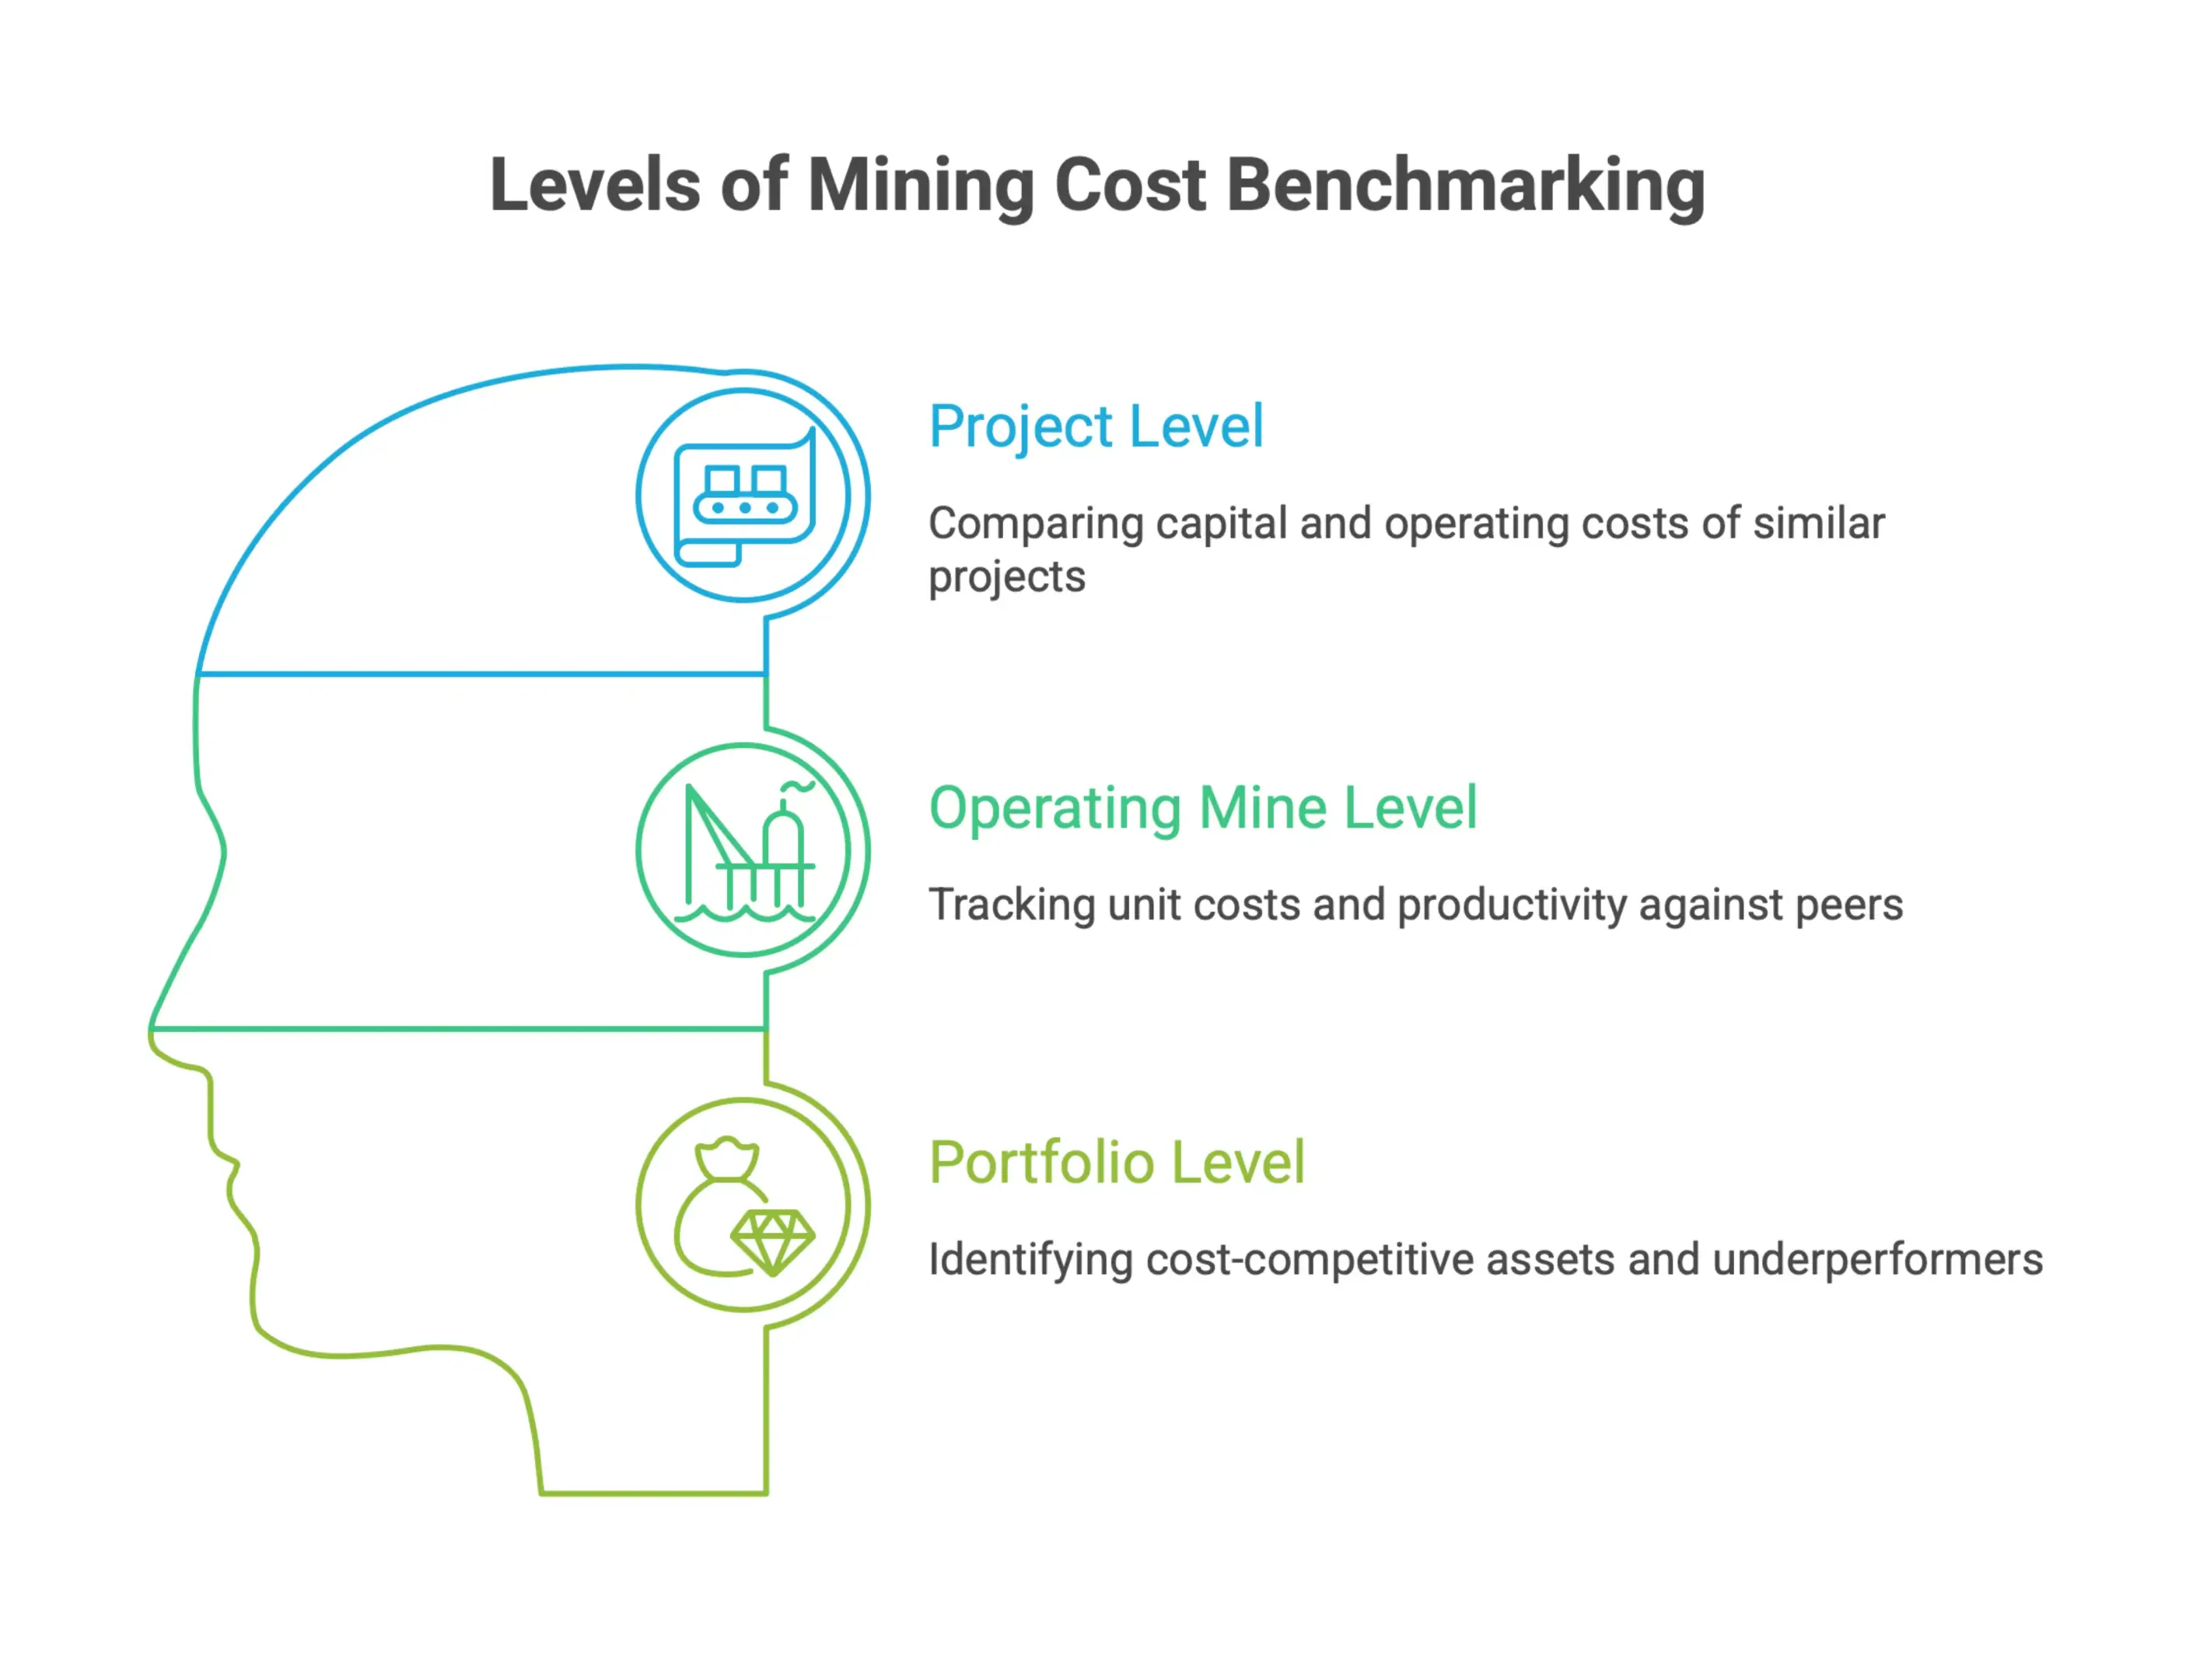
Benchmarking can be applied at several levels:
- Project level: Comparing capital intensity and operating cost estimates against similar mining projects at comparable stages of development
- Operating mine level: Tracking unit costs, productivity ratios, and sustaining capital against sector peers
- Portfolio level: Identifying which assets are cost-competitive and which ones are dragging on value
The scale of this analysis matters. According to PwC, the world’s top 40 mining companies generated revenues of US$909 billion in 2025, up 3.3% year over year, with net profit reaching US$120 billion. At that level, even small differences in cost position can add up to billions in value gained or lost across a portfolio.
Why Benchmarking Mine Costs Is Becoming a Board-Level Priority
Mining boards have long focused on reserve replacement, commodity exposure, and project delivery. Cost benchmarking was often left to technical teams or the finance function. That is changing.
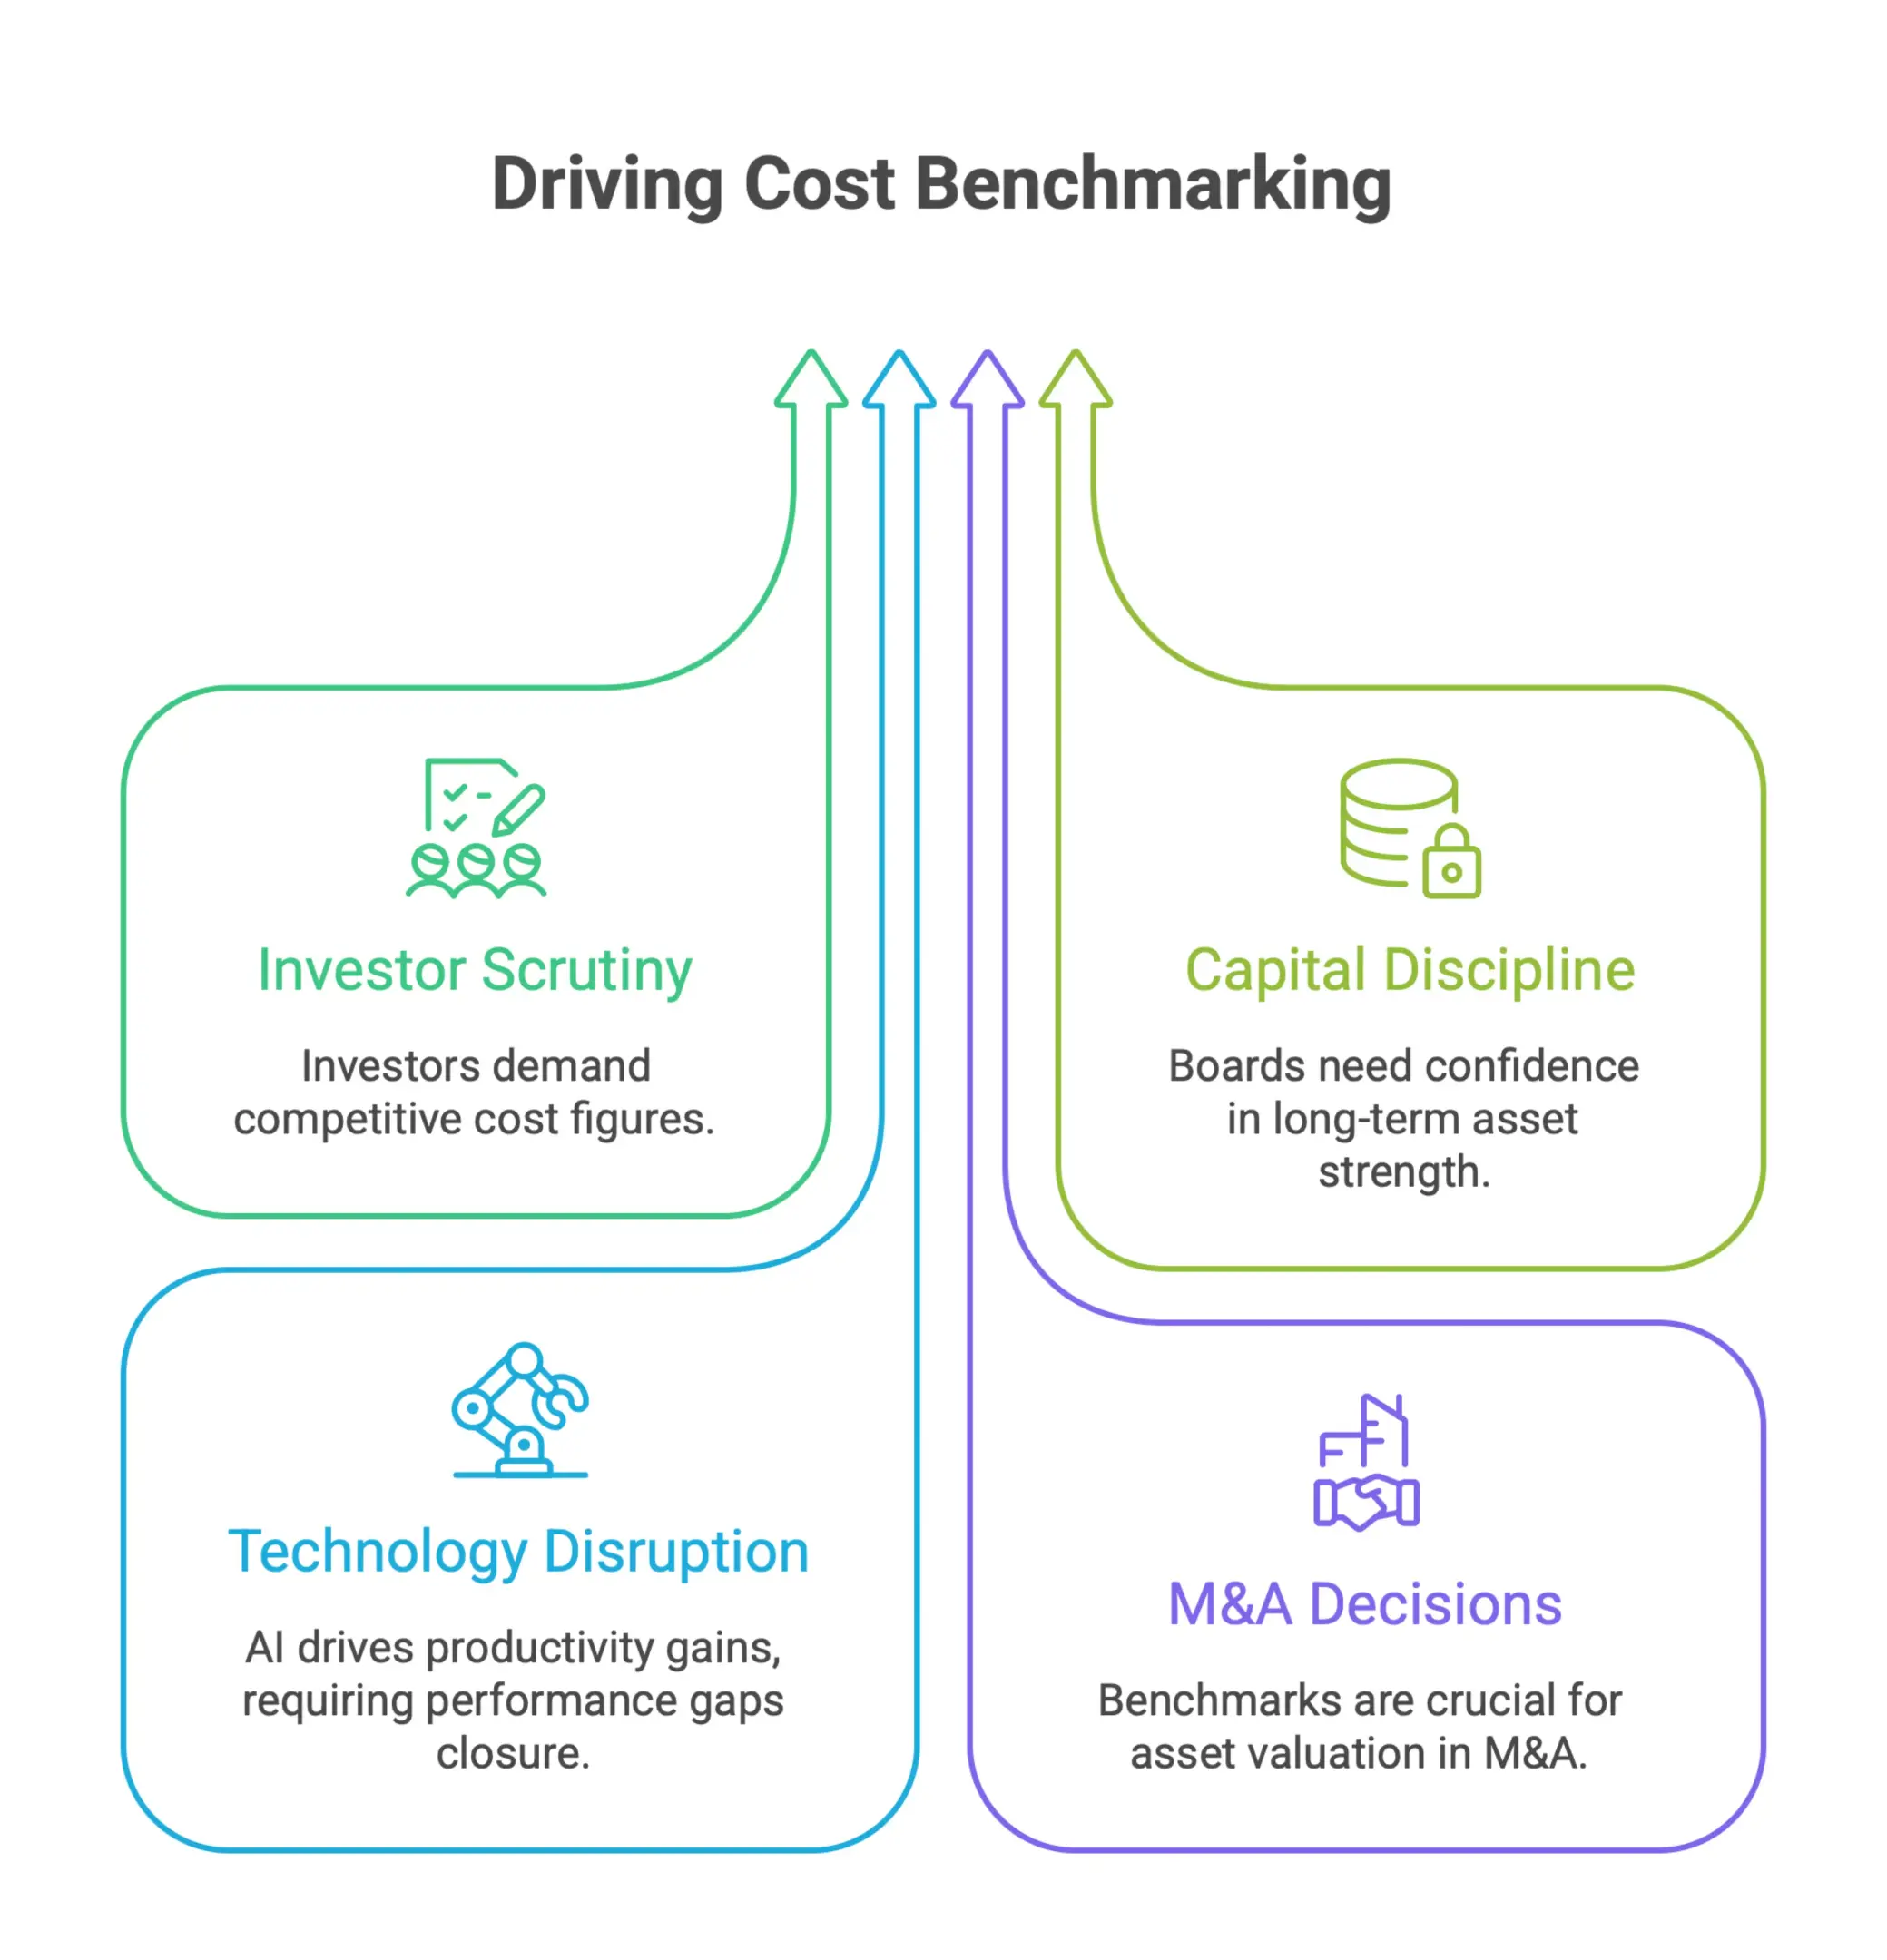
A few pressures are pushing it higher on the agenda:
- Investor scrutiny: Institutional investors and ESG-focused funds want more than headline cost figures. They want to know whether an operation is genuinely competitive
- Capital discipline: With energy, labor, and materials all costing more, boards need confidence that new capital is going into assets with real long-term strength
- Technology disruption: PwC points to AI as a major driver of productivity gains across mining. Operations that do not benchmark and close performance gaps risk falling behind as early adopters pull away
- M&A and divestment decisions: Solid benchmarks are essential for asset valuation, whether a company is buying, selling, or reshaping its portfolio
Boards that treat benchmarking as an occasional exercise are still making capital decisions with a partial view. Boards that build it into ongoing management get a much clearer read on where value is being created, and where it is quietly leaking away.
Key Metrics to Benchmark: AISC, C1 Costs, Sustaining Capital, Unit Costs, and Capital Intensity
Good benchmarking depends on consistency. If teams compare the wrong cost definitions, or use metrics that are calculated differently from one company to the next, the result is usually noise, not insight. The most common mining benchmarks are:
All-In Sustaining Cost AISCAISC is the broadest operational cost metric. It includes cash operating costs, royalties, sustaining capital, and corporate-level costs. It is widely used in gold and silver mining, and increasingly across other commodities as well. Because it captures the full sustaining cost base, it gives a clearer view of cash flow resilience at different price levels.
C1 Cash CostC1 is the direct cash cost of producing one unit of metal, net of by-product credits. It is common in copper, nickel, and zinc. Direct cash costs include core mining and refining expenses. It does not capture everything AISC does, but it is useful when comparing site-level operating efficiency.
Non-cash costs such as depreciation and amortization sit outside cash cost measures in some frameworks.
Some benchmark frameworks also track capitalized cash costs such as mine development and deferred stripping separately from operating measures.
Sustaining CapitalThis is the capital spending required to keep current production running at its present level. When benchmarked against peers, it shows whether an operation is being properly maintained or quietly building up deferred maintenance that will become expensive later.
Unit Operating CostsUnit costs, often shown per tonne of ore processed or per tonne of material moved, are a straightforward measure of operational efficiency. They are especially useful for separating mining, processing, and G&A costs, so teams can see exactly where an operation is outperforming or falling behind.
Capital IntensityCapital intensity is usually expressed as capital cost per annual tonne of production capacity. For project development, it is one of the most important metrics available. It helps developers, investors, and technical teams judge whether a project has been estimated and designed within a credible range compared with similar mining projects.
Each metric tells a different part of the story. Together, they show where an operation or project sits on the global cost curve, and what that means for competitiveness, cash generation, and future capital decisions.
For teams building a repeatable framework, cost benchmarking tools can help standardize comparisons and keep metrics aligned across peers.
The Strategic Value of Mining Cost Benchmarking for Capital Allocation
In a commodity market where prices can move sharply in a single quarter, mining executives keep coming back to the same question: where should capital go next? Experience and instinct matter, but they are not enough on their own. Cost benchmarking gives decision-makers a grounded way to compare priorities, whether the choice is an expansion, an acquisition, debt repayment, or returning cash to shareholders.
Used consistently, benchmarks turn capital allocation from a reactive call into a strategic discipline.
Using Benchmarks to Compare Organic Growth, M&A, Debt Reduction, and Returns
Capital allocation in mining is rarely straightforward. Organic growth, M&A, debt reduction, and shareholder distributions all carry different risks, timelines, and tradeoffs. Cost benchmarking helps leadership work through that complexity by giving every option the same reference point.
According to PwC, aggregate net operating cash flows for the top 40 mining companies rose 12% to US$173.6 billion in 2025. That is a strong improvement in cash generation, but capital velocity stayed flat. PwC treats that as one of the key strategic questions heading into 2026: should the industry put that liquidity into M&A, organic growth, debt reduction, or shareholder returns?
Cost benchmarks help answer that question. If a company knows how its all-in sustaining costs stack up against peers, and against a potential acquisition target, it can judge whether a deal would actually strengthen its position or simply add complexity. The same logic applies to internal mining projects. Benchmarking those costs against industry medians shows whether growth plans are truly competitive, or whether the same capital might deliver better risk-adjusted returns through debt reduction or buybacks.
The important part is consistency. Benchmarking only works when the same cost definitions and boundaries are used across every option being considered.
Benchmarking Capital Discipline in a Higher-Cash-Flow Mining Cycle
More cash does not automatically lead to better decisions. Mining history is full of upcycles where companies pushed capital into projects that looked attractive at high commodity prices, only to discover they were far less compelling once the cycle turned.
In a higher-cash-flow cycle, controlling capital expenditures and overall expenses is central to capital discipline.
The 12% increase in net operating cash flows reported by PwC for the top 40 miners in 2025 is a meaningful signal. But the flat capital velocity figure alongside it suggests the industry is showing more restraint than it has in past cycles. That restraint is exactly where benchmarking proves its value.
By tying capital decisions to verified cost benchmarks instead of optimistic assumptions, companies can:
- Identify which assets or projects stay competitive across different commodity price scenarios
- Set internal hurdle rates that reflect actual cost structures, not wishful thinking
- Avoid overextending on growth when cost inflation is rising right alongside commodity prices
In practice, benchmarking acts as a discipline check. It helps companies avoid expanding the portfolio in ways that look smart during a strong cash-flow period but quietly erode returns over the full cycle.
How Cost Benchmarks Support Portfolio Optimization Across Mines and Commodities
For diversified miners managing assets across several commodities and regions, portfolio optimization is not a one-time decision. It is a continuing process. Cost benchmarking gives leadership a common way to compare assets that would otherwise be difficult to line up side by side.
A copper operation in South America and a gold mine in West Africa may have completely different cost drivers, infrastructure needs, and labor conditions. Without a benchmarked cost framework, objective comparison is difficult at best. With one, leadership can rank assets by cost competitiveness, see which operations are creating real value at current commodity prices, and identify which assets may need to be divested or restructured.
That ties directly to the question raised by PwC: with the top 40 miners sitting on stronger cash positions, clear and defensible portfolio decisions matter more than ever. Benchmarking supports those decisions by making the cost performance of each asset visible and comparable, whether the goal is deciding where the next dollar of capital should go or deciding whether a commodity exposure should be increased or trimmed.
Good portfolio optimization also depends on fresh benchmarks. Static comparisons lose value quickly as input costs, exchange rates, and operating performance change. Companies that treat benchmarking as an ongoing discipline, not just an annual report, are much better positioned to move when market conditions change.
A mining cost workflows hub can also help teams connect benchmarking to broader sector-specific estimating and planning.
Benchmarking Operating Costs and Mine Cost Curves
Knowing where your operation sits on the cost curve is one of the most useful strategic checks in mining. It influences investment decisions, shapes hedging strategy, and gives a clearer view of how a project will hold up when commodity prices soften. Cost benchmarking turns operational data into something far more actionable: a clear view of competitive position, margin exposure, and long-term viability.
How Mine Cost Curves Reveal Competitive Position and Margin Risk
A mine cost curve ranks the production cost of every major operation in a commodity market, from lowest to highest. It is a simple idea, but a powerful one. It shows not just what it costs to produce, but where that cost sits relative to the rest of the market.
For operators, that matters in two important ways.
First, it shows margin resilience. Mines in the lower half of the curve can usually stay profitable through downturns that force higher-cost producers to scale back or shut in production. Second, it shows the market’s natural floor. When prices fall toward the upper end of the curve, the highest-cost producers start to exit, supply tightens, and prices often find support. Understanding that pattern helps operators read the cycle instead of just reacting to it.
Cost curve analysis also exposes project-level margin risk. A mine that looks healthy on its own can look very different once it is compared against peers. Ore grade, processing complexity, remote location, and energy sourcing can all push costs well above the industry median, which can squeeze margins even when prices are relatively strong.
For pre-feasibility and feasibility assets, cost curve position is increasingly a deciding factor for capital allocation. Investors and lenders want to know whether a project can survive volatility. Cost curve placement is one of the clearest ways to show that.
Benchmarking AISC and Unit Costs by Commodity, Region, and Mine Type
All-in sustaining cost, or AISC, has become the go-to benchmark across many commodity sectors. It gives a more complete view of operating cost than cash cost alone because it includes sustaining capital, royalties, and corporate overhead. Used consistently across operations, it gives operators and investors a comparison they can actually rely on.
That said, good benchmarking is never just one headline number. AISC and unit costs vary widely by commodity, region, and the technical profile of the mine itself. A surface lithium brine operation in South America has a very different cost structure from an underground hard-rock lithium mine in North America. Comparing them without adjusting for those structural differences leads to bad conclusions.
The same logic applies geographically. Labor markets, power infrastructure, regulation, and logistics all create cost advantages or penalties that a broad benchmark will miss. Breaking the data down by region and mine type gives operators a peer set that is much more useful.
For individual commodities, sector data adds important context. According to S&P Global, cobalt operations are expected to see AISC rise to about US$8.55 per pound in 2026, a year-over-year increase of roughly 5.5%. That gives cobalt producers a useful reference point for checking whether their own cost trend is tracking with the market or drifting away from it.
Benchmarking at this level of detail supports better decisions across the full project lifecycle, from early capital screening through operational improvement programs and portfolio planning.
Accounting for Inflation, Energy, Labor, Grade Decline, and New Supply in Cost Benchmarks
A cost benchmark is only useful if the assumptions behind it still reflect reality. Static historical averages can be misleading, especially when cost pressures are building across the industry. If you want a benchmark that holds up, it has to account for the forces actively reshaping cost curves and reflect long term costs, not just current period pressure.
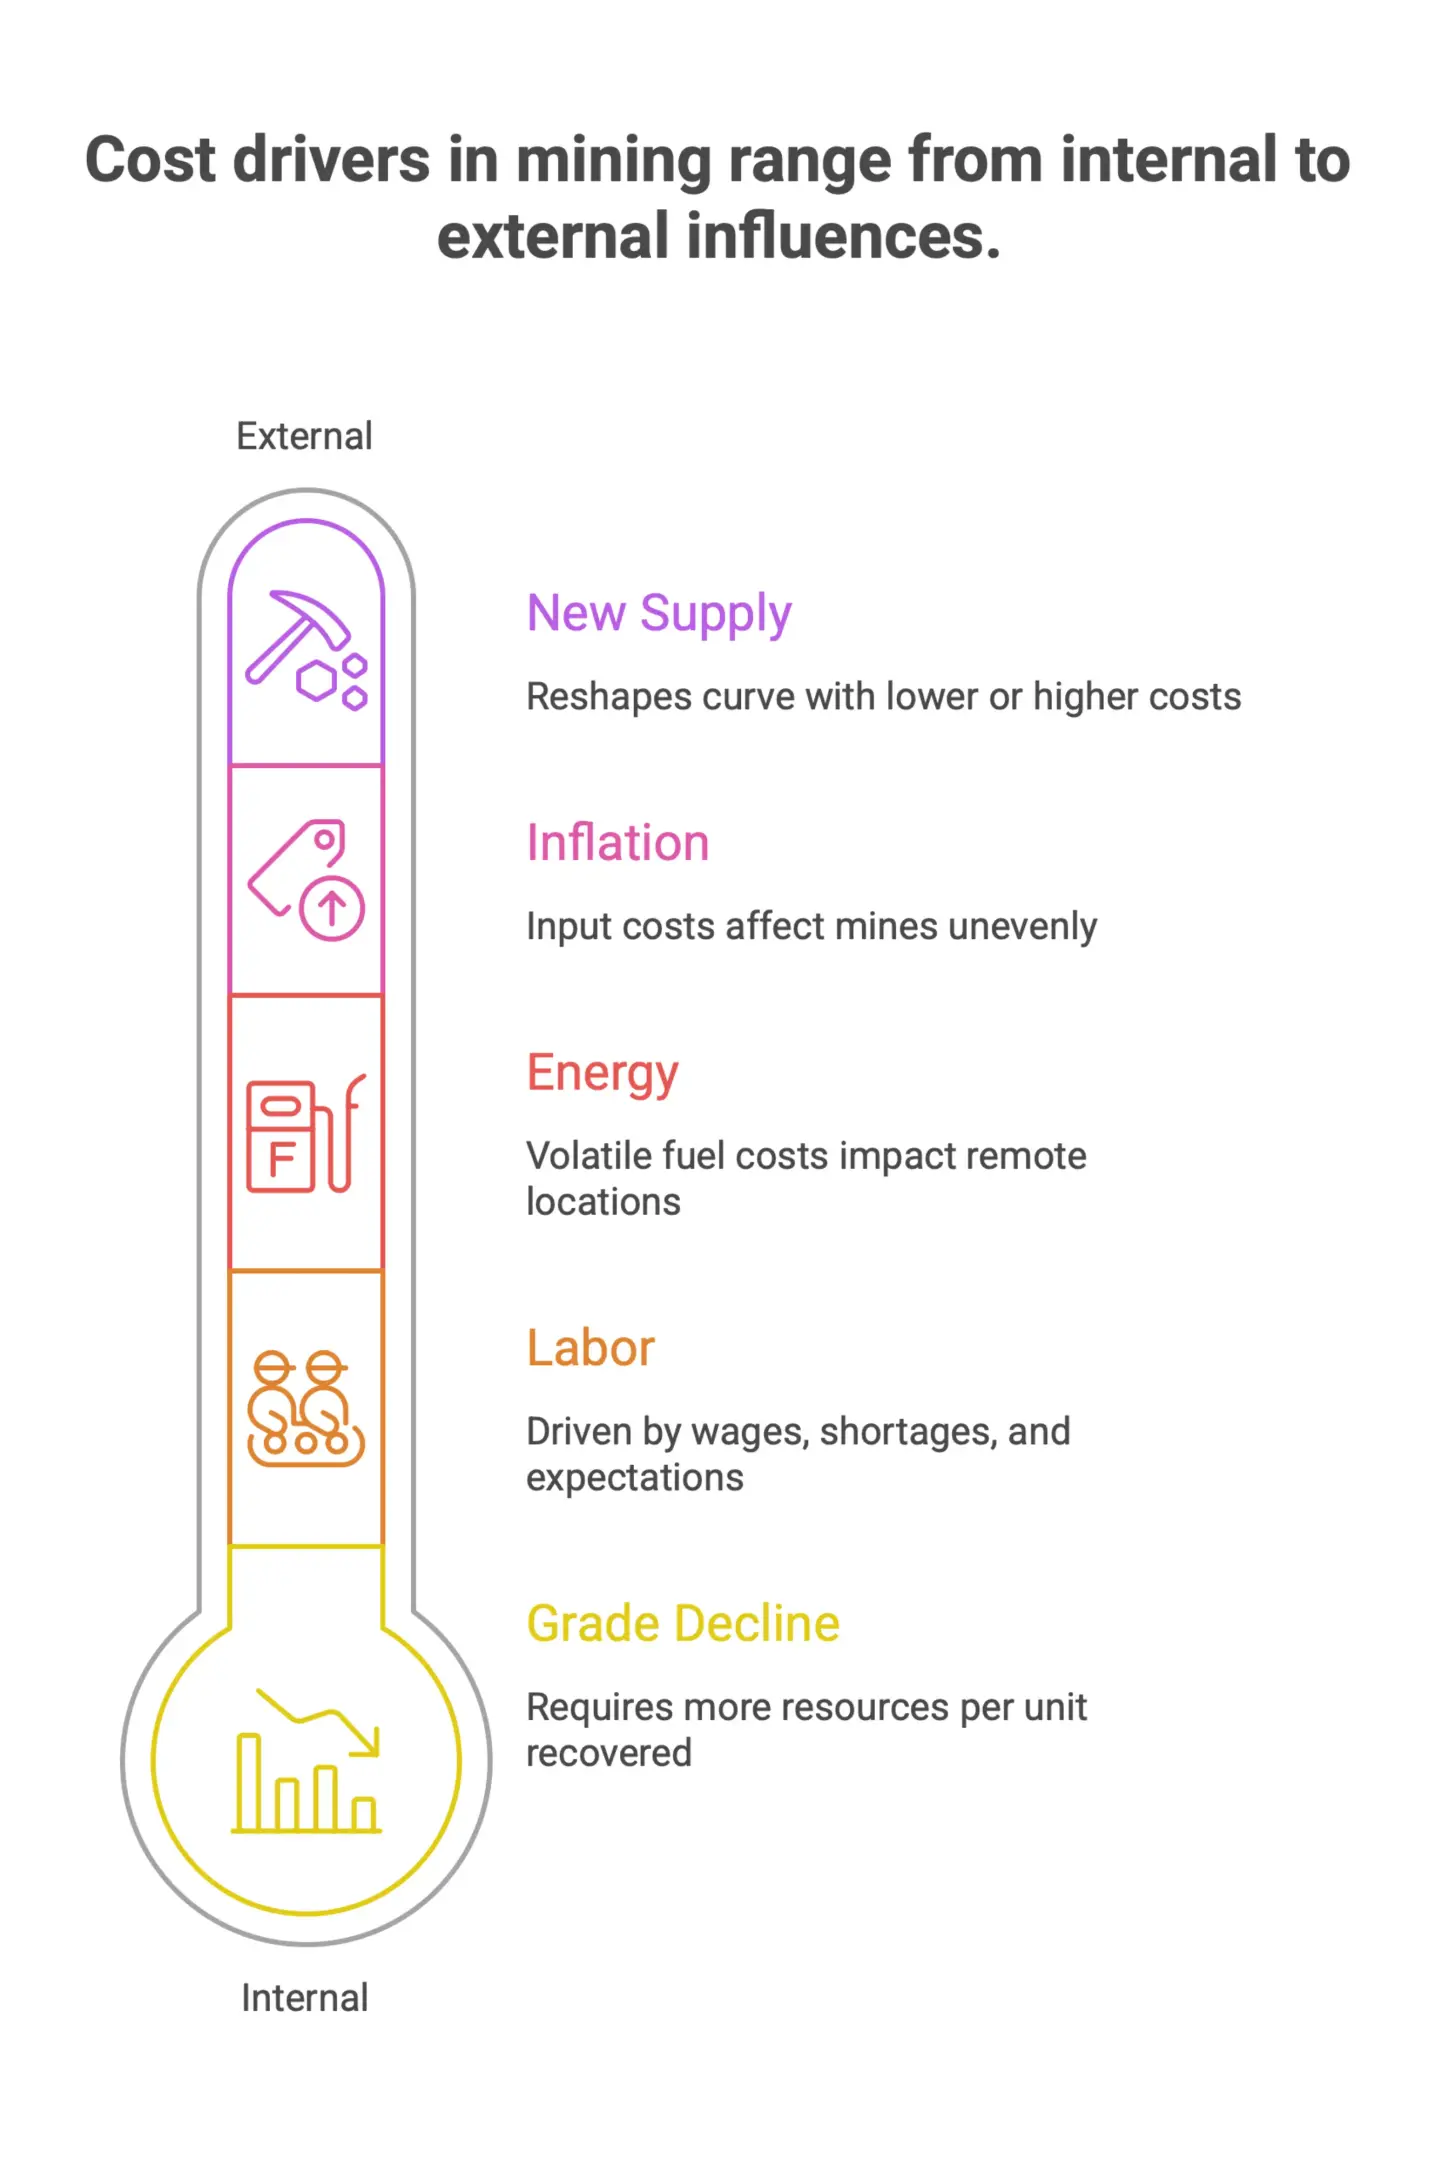
A few drivers matter more than most:
- Inflation: Input costs affect every operating mine, but not evenly. Long-term supply contracts can soften the blow for some operations, while others feel immediate pressure from higher prices for consumables, reagents, and equipment.
- Energy: Energy is often one of the biggest cost items in mining, usually accounting for 20 to 35 percent of operating costs depending on the process. Diesel volatility and rising fuel costs in remote locations can move a mine’s position on the cost curve quickly.
- Labor: Wage inflation, labor shortages, and changing workforce expectations are pushing costs up across most mining regions. Underground and technically complex operations tend to feel that most.
- Grade decline: As high-grade zones are mined out, lower-grade material becomes the norm. That means more energy and more reagents are needed per unit of metal recovered, which raises costs over time. Benchmarking needs to capture that structural shift.
- New supply: New mines can reshape the curve by adding lower-cost production and pushing higher-cost incumbents further to the right. In other cases, new mining projects come in with higher operating and capital costs than existing mines, which can lift the whole curve.
S&P Global points to inflation and new supply as the main forces reshaping cost curves heading into 2026, with cobalt showing how those pressures translate into measurable cost growth at the commodity level.
Once those variables are built into the benchmark, it becomes much more than a snapshot. It turns into a practical decision tool for mining companies. Operators who track cost escalation drivers alongside peer comparisons are in a much better position to spot risk early, adjust plans before costs get away from them, and present forecasts that stakeholders can trust.
For teams that want a dedicated benchmark model, CosMO is built for cost normalization and historical project comparison.
Project Cost Benchmarking for Mining Development and Feasibility Studies
Taking a mining project from early scoping to final investment decision is rarely a straight line. Costs get revised, assumptions shift, and different stakeholders often read the numbers differently. For owners, lenders, and technical advisors, project cost benchmarking is one of the best ways to cut through that uncertainty. It means comparing capital and operating estimates across study stages, models, and project contexts to see where they line up and where they do not.
Done properly, benchmarking does more than confirm whether an estimate looks reasonable. It exposes optimistic assumptions, catches project scope that is missing or counted twice, and gives decision-makers a more grounded view of what the mining project is likely to cost in the real world.
Why Scope Normalization Is Critical in Mining Project Cost Comparisons
Before any comparison is worth trusting, the project scope behind each estimate has to be aligned. Two capital cost figures for projects that look similar can end up miles apart for reasons that have little to do with actual cost performance. One estimate may include owner’s costs and contingency, while another only covers direct construction. Differences in infrastructure, site conditions, or phasing can move the numbers just as much.
That is why scope normalization is the first serious step in any credible benchmarking exercise. Without it, raw cost comparisons can be misleading, and in some cases, they can push teams toward the wrong conclusion about project viability.
When technical teams normalize scope before comparing estimates, they are really checking whether the same work is being priced under the same assumptions. That usually means lining up:
- Process plant capacity and configuration
- Infrastructure items such as roads, power, and water supply
- Contingency levels and estimate basis
- Operating context factors, including site-specific factors such as location, labor market, and logistics
Once those variables are aligned, the comparison starts to tell you something useful. As Costmine Intelligence has shown in its benchmarking work, the real objective is to understand where capital estimates converge after normalization, not just whether two headline numbers happen to be close.
Benchmarking Capital Costs from Scoping Study to FID
Capital cost estimates evolve through Conceptual, Pre-Feasibility, and Feasibility phases before FID, and they can change a lot as a mining project matures. A scoping study estimate might sit in the plus or minus 35 to 45 percent range, while a bankable feasibility study aims for plus or minus 15 percent or better. Benchmarking at each stage has a different job to do.
In early-stage studies, benchmarking helps owners test whether their cost assumptions are in line with comparable mining projects. It can quickly show whether a project is being advanced on unrealistic cost expectations, long before major capital is committed to further study work.
As the project moves toward feasibility and then FID, the focus becomes more detailed. Lenders and independent technical advisors are no longer just looking at the total number. They want to know how the major cost blocks, or capex components, compare with industry norms. Process plant capital, infrastructure, and pre-production operating costs all come under closer review.
Being able to track how estimates evolve from one study stage to the next, and compare them against independent models, gives technical teams a much clearer view of estimate maturity and confidence. This kind of staged benchmarking is becoming more common as projects get larger and financing requirements become more demanding.
Comparing Independent Cost Models Against Owner Estimates
One of the most useful benchmarking checks is to place an owner’s estimate beside an independent cost model for the same project. These two views usually start from different assumptions. Owner teams often have access to vendor quotes, site-specific information, and contractor input. Independent models, by contrast, are typically built from first principles using cost databases, factored methodologies, and benchmarking tools such as Nomitech’s WOODY.
The differences between the two are often where the real value sits. Sometimes the independent model confirms the owner’s estimate, which helps build confidence with lenders and lowers the risk of surprises during execution. Other times, the gap highlights areas that need a closer look, whether that means reviewing scope inclusions, pressure-testing productivity assumptions, or revisiting commodity price inputs.
Costmine Intelligence published a detailed benchmarking comparison focused on First Quantum's Taca Taca Copper Gold Project, placing the owner's estimates alongside Costmine's own WOODY independent cost model. The analysis looked at where the capital estimates converged after scope normalization and whether the operating cost gap stayed within a modest range. That kind of structured comparison is exactly what serious projects, and the financiers behind them, increasingly expect before capital is committed.
For technical teams building or reviewing feasibility studies, reliable benchmarking data and well-structured independent models are not a nice-to-have. They are part of disciplined project development.
If you are setting up the workflow itself, cost modeling and benchmarking can help teams normalize inputs and compare projects more consistently.
Cost Benchmarking Across the Mining Project Finance Lifecycle
Mining projects rarely move in a neat line from discovery to production. Technical uncertainty, volatile commodity prices, and the need to secure funding at each stage all shape the path forward. Cost benchmarking matters throughout that journey, but it becomes especially important when financial exposure is high and the project is still full of unknowns.
Reducing Financing Risk Between Discovery and Final Investment Decision
The period from exploration through final investment decision, or FID, is one of the toughest stretches in mining project finance. PwC describes it as a "valley of death," where projects need significant capital to keep moving but still cannot point to contractable cash flows that give lenders or investors comfort. According to PwC, development finance institutions and blended finance structures are the most dependable sources of support during this phase.
For project teams, that creates a clear problem. Without revenue history and without fully de-risked capital estimates, it is hard to persuade financiers to commit. Cost benchmarking helps narrow that gap. When estimates are backed by credible cost data from comparable projects, they carry much more weight in early funding discussions.
Benchmarks show that capital and operating assumptions are tied to market reality, not just optimistic modelling. That matters when financing decisions are being made with limited hard data.
Using Benchmarks to Strengthen Technical Reports, Lender Reviews, and Investment Cases
Technical reports, independent engineer reviews, and investment memoranda all have the same basic job. They ask a qualified third party, or a sophisticated investor, to believe that the numbers hold up. Benchmark data gives those documents a stronger base.
For estimators and project finance teams, this means looking beyond internal models. Bringing externally validated benchmarks into prefeasibility and feasibility studies shows that the team has tested its assumptions against what similar mining projects have actually cost to build and run.
In lender reviews, independent engineers often focus on contingency, escalation, and overall cost credibility. Projects that arrive with benchmark-supported estimates are in a much better position to handle that scrutiny. They also reduce the back-and-forth that can slow financial close and weaken confidence among co-investors.
The same applies to investment cases shared with equity partners or development finance institutions. Since these institutions are often among the few reliable funding sources before FID, as noted by PwC, presenting well-benchmarked cost data is more than good housekeeping. It can directly improve the odds of securing the capital needed to move ahead.
How Benchmarks Improve Confidence in Contingency, Escalation, and Risk Allowances
Contingency, escalation, and risk allowances are often the most debated parts of a mining cost estimate. They are also the easiest places for weak assumptions to undermine credibility with financiers and technical reviewers. Some teams also use simulation to determine appropriate contingency levels under uncertainty.
Without benchmark context, these allowances can look arbitrary. A 15% contingency might be exactly right, or it might be far too high or too low, depending on the project type, location, and engineering stage. Benchmark data gives teams a reference point they can use to defend those decisions with much more confidence.
When project teams can show that their contingency and escalation assumptions line up with what similar mining projects carried at the same stage, the estimate becomes harder to challenge. That is especially valuable before FID, when cost certainty is still limited and lenders are looking closely for any weakness in the numbers.
Good benchmark data does not remove risk management. It gives teams a clearer way to define it and explain it. That is exactly what lenders and co-investors need before they commit. In a financing environment where, as PwC notes, capital access between discovery and FID is already constrained, that kind of clarity can make a real difference.
The mining industry solutions overview is a useful starting point for teams looking to connect financing-stage benchmarking with mining-specific workflows.
AI, Data Quality, and the Future of Mining Cost Benchmarking
Mining is at a turning point. The tools for cost benchmarking are far better than they used to be, but many operators are still working with fragmented data, inconsistent reporting, and limited analytical bandwidth. AI can help close that gap, but only if the groundwork is in place.
This section looks at where AI can strengthen cost benchmarking in practice, and what needs to be sorted out first.
Why AI-Ready Mining Companies May Gain a Benchmarking Advantage
Mining companies are not all starting from the same place when it comes to AI adoption, and the gap between the prepared and unprepared is getting wider.
According to PwC, mining scored lower than any other sector on its AI fitness index. That is a notable result for an industry that produces so much operational data. The same report also points to the upside: the most AI-fit companies are seeing performance improvements 7.2 times greater than those that are less ready.
In cost benchmarking, that difference is hard to ignore. Companies with stronger AI readiness can make benchmarking more data-driven as they work through larger volumes of operational and financial data, spot cost variances sooner, and compare themselves against industry benchmarks with more confidence. Teams that are behind on AI maturity usually benchmark less often and with less precision, which makes it harder to react quickly when costs start moving in the wrong direction.
The point is not that every mining company needs to roll out AI tomorrow. It is that the ability to use AI well is becoming a real competitive advantage, especially in cost management where even small gains can affect project viability. Tools like Nomitech’s can support that transition by giving teams cleaner cost data and a more consistent basis for comparison.
Applying AI to Cost Forecasting, Scenario Analysis, and Productivity Benchmarks
Once the right data structure and governance are in place, AI and data analytics can add value across several key benchmarking workflows.
Cost forecasting becomes more responsive when AI is trained on historical cost data. Instead of leaning only on static unit rates or a single point estimate, AI-assisted models can pick up patterns across similar projects and highlight where current cost estimates may be too optimistic or out of step with recent market conditions.
Scenario analysis is another area where AI can save a lot of manual effort. If a team needs to understand how changes in energy prices, labor availability, or ore grade will affect project cost, it usually means running multiple models and comparing the results. AI can speed that process up and give planning teams a clearer view of risk before decisions are locked in.
Productivity benchmarking can also become more useful. Better benchmark visibility can improve maintenance strategies by supporting a shift toward predictive maintenance. AI can help isolate where a site is underperforming relative to peers, whether the issue is equipment utilization, shift structure, or maintenance timing, and that stronger visibility can also improve safety on site. That kind of detail is difficult to pull out through standard reporting alone.
As PwC points out, mining’s weak AI performance is tied in part to limited investment in innovation. Companies that have not invested in analytical tools are unlikely to have the setup needed for these workflows, which means the benefits of AI-driven benchmarking are still concentrated among a smaller group of more forward-looking operators.
Building Reliable Data Governance for Mine Cost Benchmarking
AI is only as useful as the data behind it. For many mining companies, that is the first real hurdle.
PwC identifies weak data and governance frameworks as a major reason the mining sector trails on AI readiness. Without consistent data standards, clean cost classifications, and clear ownership, the output from any benchmarking model, AI-driven or not, will be shaky.
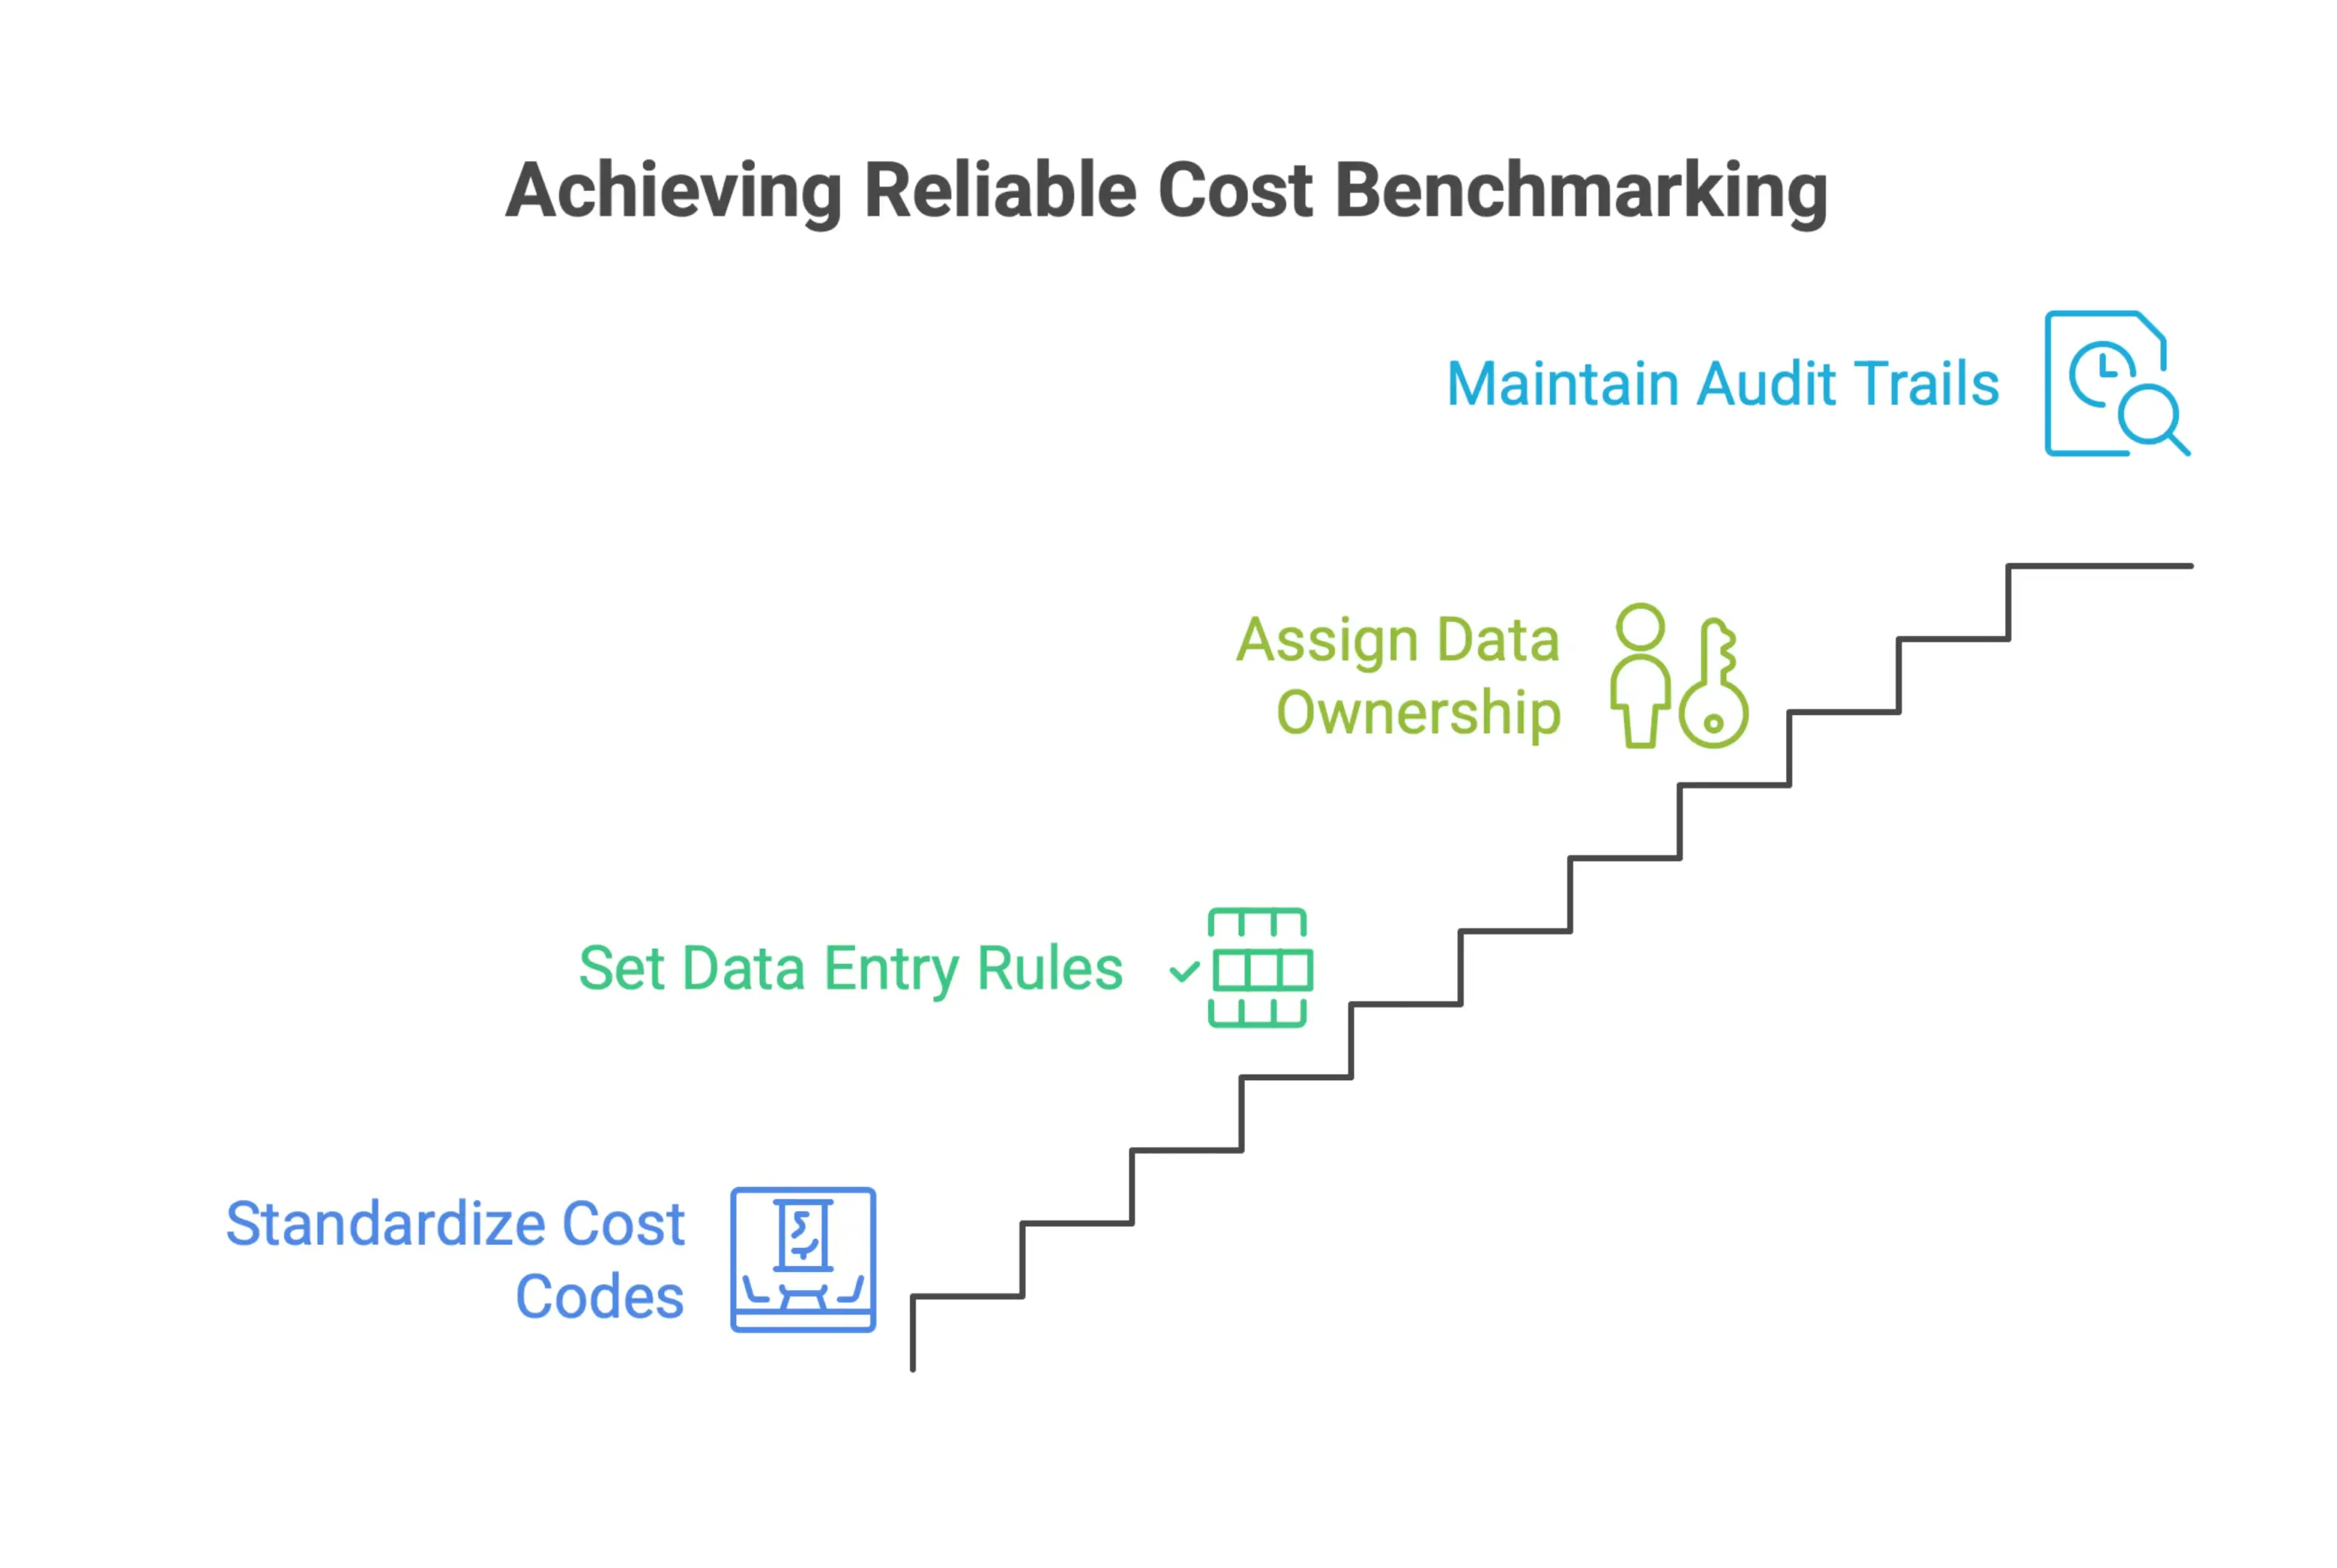
Good data governance for cost benchmarking usually comes down to a few practical habits:
- Standardizing cost codes and categories across projects and sites so comparisons are genuinely like for like
- Setting clear data entry rules to cut down on inconsistency, especially in field reporting and procurement records
- Assigning ownership and accountability for data quality so issues are caught early instead of flowing into forecasts
- Keeping audit trails that show how a figure was built and what assumptions sit underneath it
None of that is flashy, but it is what makes advanced benchmarking usable in the real world. Companies that buy into AI before fixing data quality often end up with outputs they cannot fully trust, which makes it harder to act on the results with confidence.
Mining already has the data. What it often lacks is the structure and discipline to use that data well. Fixing that is the starting point for everything that follows.
For a broader view of enterprise capabilities, the Nomitech platform covers AI-ready cost estimating and benchmarking across products and industries.
Benchmarking Shareholder Returns Against Reinvestment Needs
Capital allocation in mining is rarely simple. Leadership teams are under constant pressure to return cash to shareholders, keep operations funded, maintain the growth pipeline, and preserve enough balance sheet strength to ride out commodity cycles. Cost benchmarking sits right in the middle of that balancing act. When you have a clear, data-backed view of where each asset sits on the cost curve and what each project can realistically deliver, decisions around dividends, buybacks, sustaining capital, and growth investment become easier to justify and more strategically grounded.
Balancing Share Buybacks with Growth Capital and Operational Resilience
The growth in share buybacks across mining points to a real shift in how companies think about returning value to shareholders. According to PwC, buybacks in the mining sector rose by 252% in 2025 to US$5.8 billion, with gold companies driving much of that activity. PwC suggests this reflects a move toward more flexible and tax-efficient ways of returning capital than traditional dividend structures.
That makes sense in a sector shaped by price swings. But it also raises an important question: when is a buyback the right use of capital, and when should that money go back into sustaining or growth assets?
This is where cost benchmarking becomes a practical decision tool. By placing each asset on an industry cost curve, companies can see which operations are truly low-cost and capable of generating cash across different commodity price environments. If an asset consistently sits in the lower quartile, the case for returning excess cash through buybacks is much stronger. If key assets are sitting in the middle or upper end of the curve and starting to feel margin pressure, that same capital may be better used to improve performance or fund sustaining work that protects long-term viability.
Benchmarking also helps with sequencing. Mining companies rarely have enough capital to fund every priority at once. A structured cost comparison across the portfolio helps leadership decide which assets need immediate reinvestment to stay competitive, which ones are mature enough to harvest for returns, and where new growth capital is most likely to deliver the best risk-adjusted outcome.
Using Cost Benchmarks to Defend Capital Allocation Decisions to Investors
Institutional investors and analysts are much more exacting about capital allocation than they used to be. Announcing a buyback or a new growth project is not enough on its own. Investors want to understand the logic behind the decision, and they expect that logic to be grounded in data rather than management optimism.
Cost benchmarking gives companies a clearer, more credible way to make that case. If a business can show that its core assets sit at a defined position on the industry cost curve, and that its reinvestment plan targets projects with competitive returns under conservative commodity price assumptions, the story becomes far more defensible.
The rise in buyback activity reported by PwC also shows that investors are open to flexible capital return strategies when the case is explained well. That explanation depends on proving that the assets generating free cash flow are genuinely resilient, and that reinvestment options have been tested against a consistent benchmark.
In practice, that means building benchmarking outputs into capital allocation frameworks and investor communications. Companies that can present comparative cost data, project-level return thresholds, and scenario-tested outcomes give boards and investors a much stronger basis for scrutiny. That usually leads to better confidence in the decision-making process, even when the answer is not always the one everyone hoped for.
Benchmarking Free Cash Flow Sensitivity Under Different Commodity Price Scenarios
One of the most useful ways to apply cost benchmarking in capital allocation is by stress-testing free cash flow under different commodity price scenarios. Mining revenues are highly exposed to metal prices, and a decision that looks sound at today’s spot price can weaken fast if the market turns.
By benchmarking operating costs at both the asset and project level against peer data, finance teams can model free cash flow under a range of price assumptions, from conservative base cases to downside scenarios that reflect a meaningful correction. That quickly shows which assets stay free cash flow positive across the full range, which ones become marginal, and which would need extra support or operational changes to remain viable.
This kind of clarity has a direct impact on how much capital can realistically be returned to shareholders, and how much should be held back as a buffer or reinvested into cost reduction and sustaining work. The sharp increase in buyback activity highlighted by PwC suggests that many mining companies, especially in gold, currently have enough free cash flow to support more flexible returns. But that position only holds if cost performance is monitored continuously and scenario analysis is used to test what happens when market conditions shift.
When cost benchmarking is built into that kind of scenario framework, it stops being a backward-looking scorecard. It becomes a forward-looking decision tool that helps leadership place capital where it can create the most durable value.
A CosMO benchmarking workflow can support scenario analysis when teams need to compare cost sensitivity across assets and price cases.
How to Build a Mining Cost Benchmarking Framework
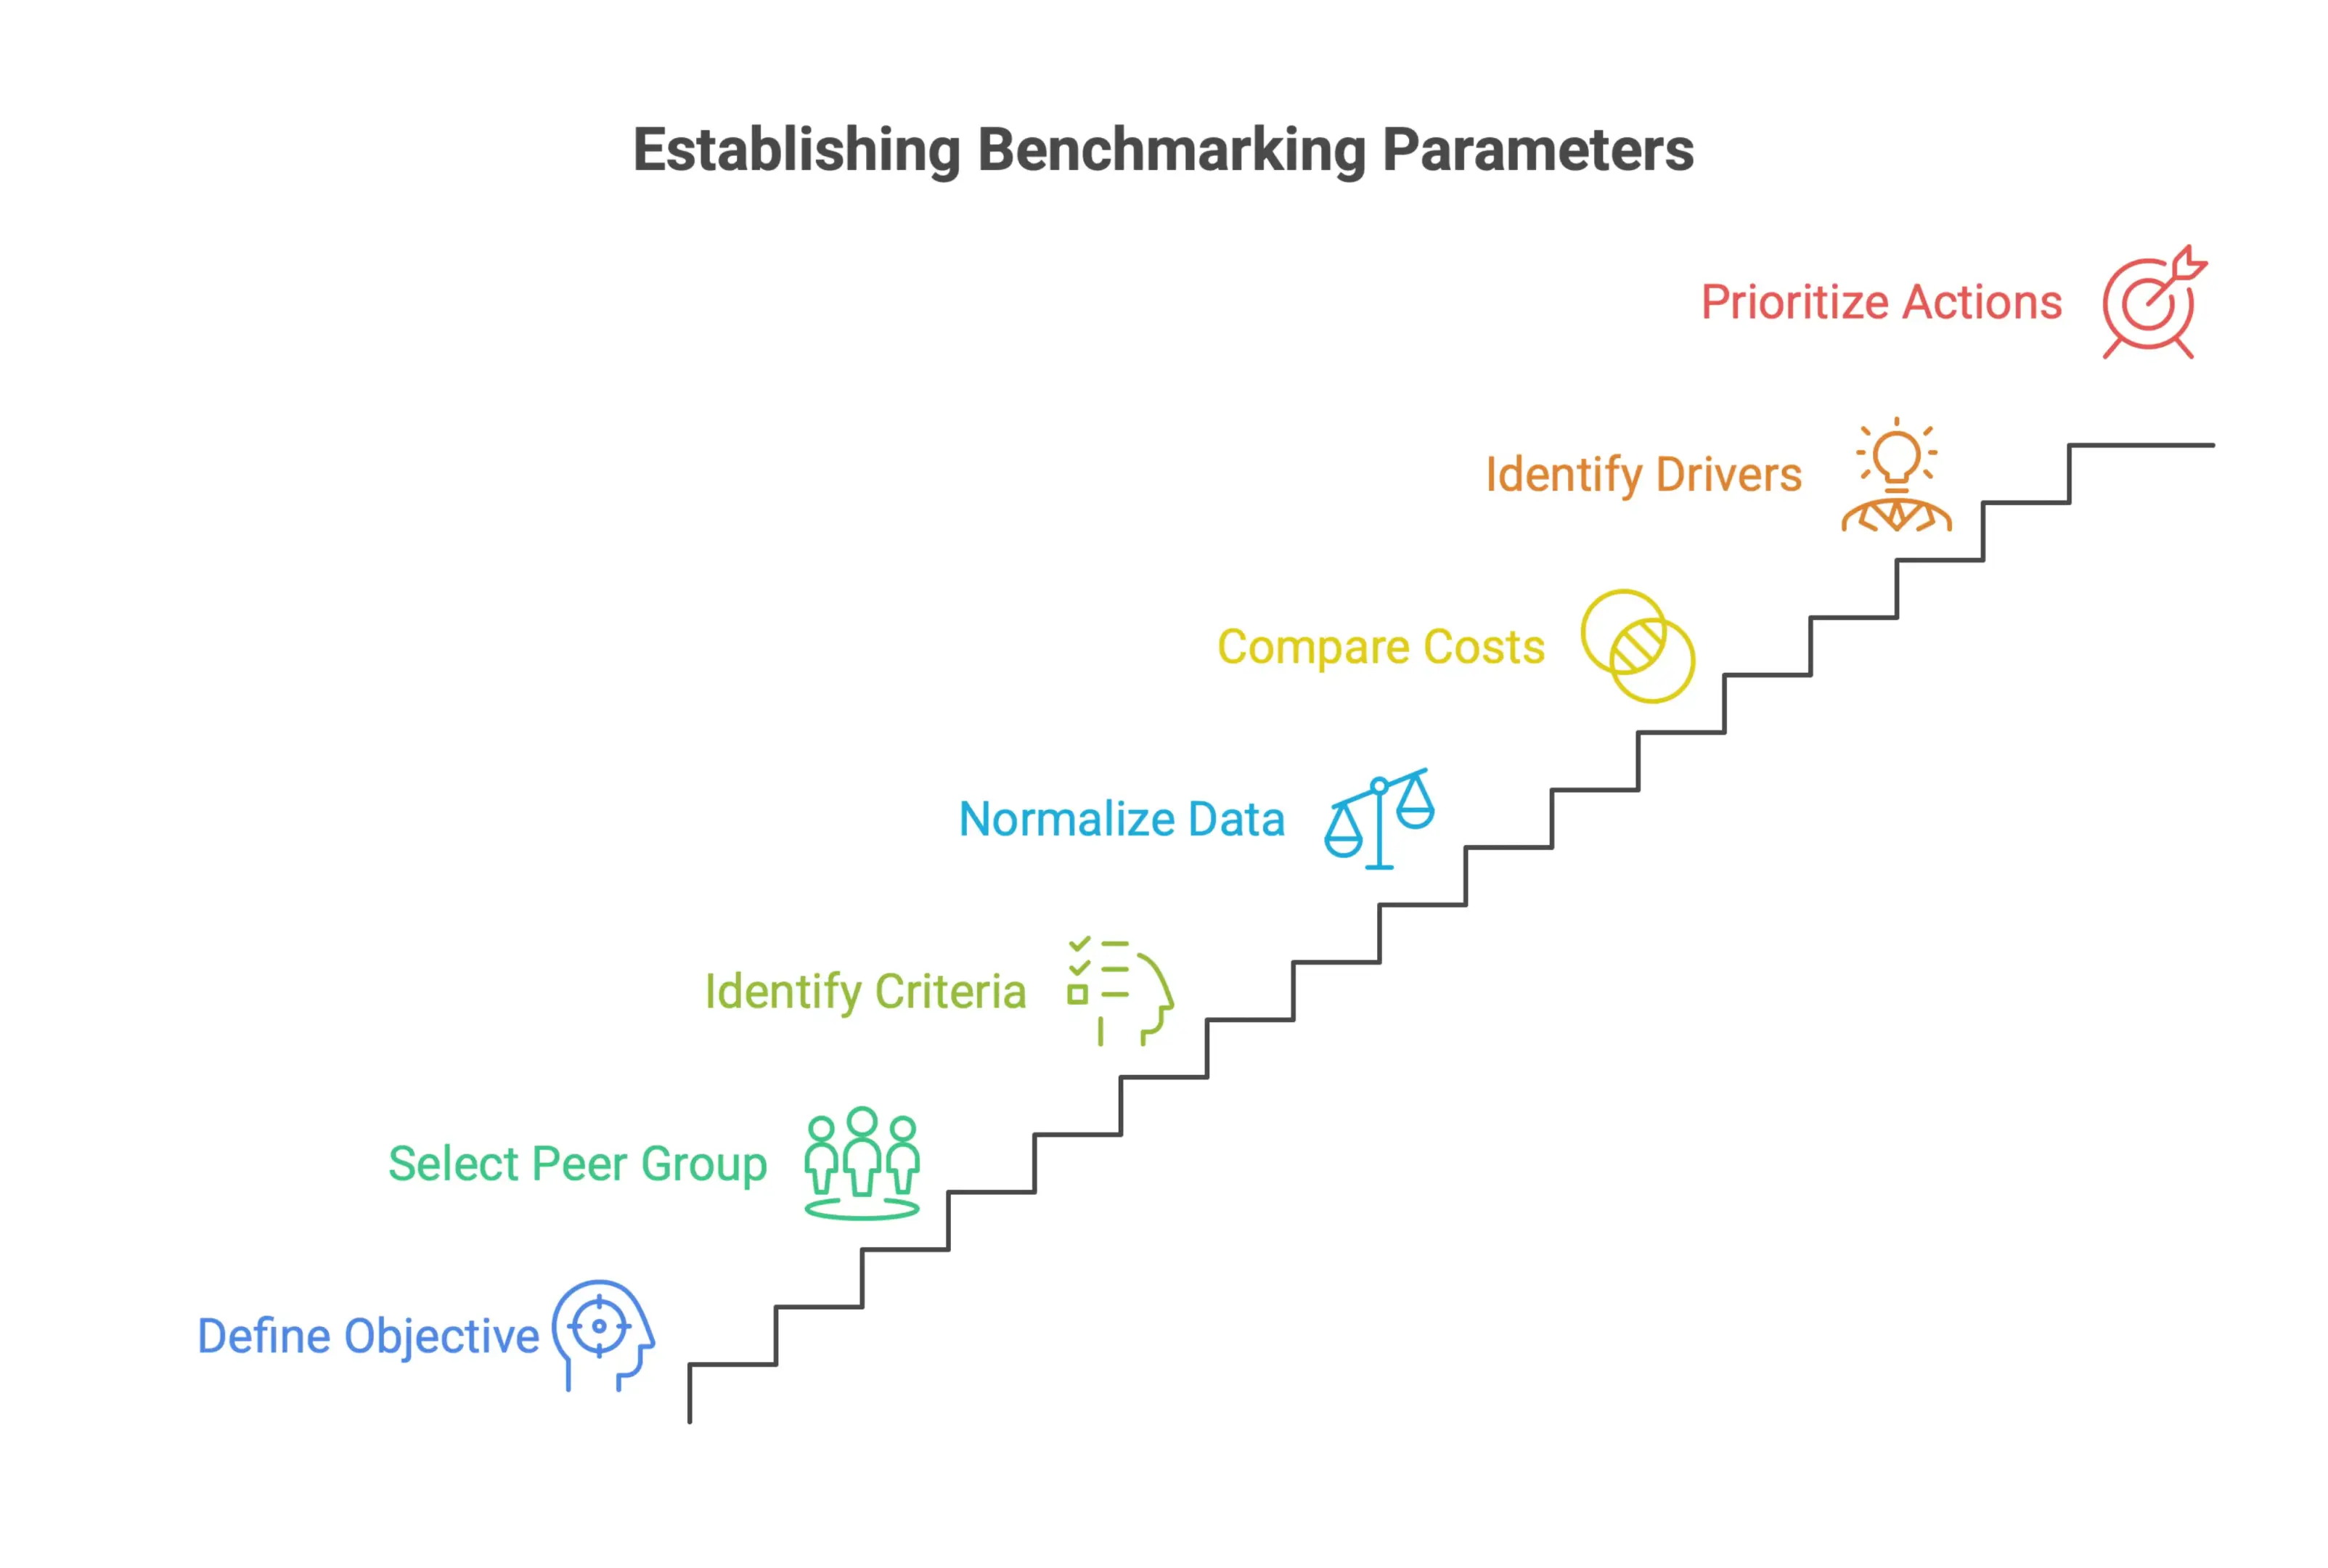
Building a cost benchmarking framework for mining operations is not a one-off task. It is a repeatable process that helps operations teams, project managers, and finance leaders see where costs sit against industry peers, understand what is driving the gap, and act on it with confidence. The steps below show how to build that framework in a practical, defensible way.
Step 1: Define the Benchmarking Objective and Peer Group
Before you collect any data, be clear on what you are trying to learn and who you are comparing against. Those two choices shape the entire analysis.
Start with the objective. Are you checking whether operating costs are competitive at the asset level? Reviewing a capital estimate against industry norms? Preparing for a board update or investor discussion? Each of those questions needs a different level of detail and a different set of metrics.
Once the objective is set, peer group selection becomes the next key decision. A peer group that is too broad creates noise. A peer group that is too narrow gives you benchmarks that look tidy but do not tell you much. The best peer groups are built around operations that are similar enough for cost comparisons to mean something, but still varied enough to highlight real performance differences.
Key criteria for peer group selection typically include:
- Commodity type (gold, copper, thermal coal, iron ore, etc.)
- Mining method (open pit vs. underground, heap leach vs. mill processing)
- Production scale and ore throughput
- Geopolitical and geographic context
- Stage of operation (early production, mature operation, end of life)
Getting this step right matters. Comparing a high-grade underground gold mine in a low-cost jurisdiction with a low-grade open pit operation in a high-cost region will produce misleading results unless you normalize heavily. Define the peer group deliberately, and document why it was chosen so the logic is clear when the analysis is revisited.
Step 2: Normalize Mine Cost Data for Scope, Geography, Mining Method, and Commodity Mix
Raw cost data from different operations, reports, or time periods is rarely comparable straight out of the gate. Normalization is what makes the comparison meaningful by aligning reported costs with industry standards.
There are four main areas where normalization matters:
Scope of cost reporting. Different companies report costs differently. Some use all-in sustaining cost frameworks. Others report cash costs, C1 costs, or site-specific operating structures. Before comparing anything, you need to confirm that the cost boundaries line up. For example, does the reported figure include royalties, corporate overhead allocations, sustaining capital, or stripping costs? Misaligned scope definitions are one of the most common reasons mining benchmarks go off track.
Geographic and labor cost adjustments. A cost per tonne figure from an operation in West Africa cannot be compared directly with one from North America or Australia without adjusting for wage rates, energy costs, contractor pricing, and compliance costs. Purchasing power parity adjustments and regional cost indices are often used to bring numbers onto a common basis.
Mining method differences. Underground mining has a very different cost structure from open pit operations. Even within underground mining, block caving, cut-and-fill, and sublevel stoping each carry their own cost profile. Normalization should either account for those differences or keep the peer group tight enough that the methods are truly comparable, especially where different mining methods are modeled as distinct cost structures.
Commodity mix and by-product treatment. For polymetallic operations, the way by-product credits are applied can materially change reported net costs. If the treatment is not standardized across the peer group, the comparison will be skewed before it even starts.
This work takes discipline and transparency. Every adjustment should be documented, and the sensitivity of the final benchmark to those adjustments should be understood. A well-normalized dataset is what makes the rest of the analysis reliable. Tools like CosMO can help teams keep that structure consistent instead of rebuilding it by hand every cycle. Normalized benchmark data can also help validate supplier contracts against market rates.
Step 3: Compare Costs, Identify Cost Drivers and Variance Drivers, and Prioritize Actions
Once the data is normalized, the real analysis begins. The point is not just to rank operations from lowest to highest cost. It is to understand why the differences exist and which ones you can actually do something about.
A good place to start is a waterfall or bridge analysis that breaks total cost per unit into its major components: mining, processing, G&A, sustaining capital, and any other material line items. When those components are compared across the peer group, the story becomes much clearer. An operation might be in line on processing costs but well above the median on mining costs, which points toward equipment productivity, contractor rates, or ore dilution as likely drivers.
From there, variance analysis should separate the differences into three buckets:
- Structural cost drivers that are largely fixed by location, geometry, or mining method
- Operational performance gaps that reflect execution, productivity, or procurement issues
- Reporting and scope differences that remain after normalization and need to be called out
Prioritizing action means weighing the size of the gap against how hard it will be to close. A 15 percent reduction in reagent consumption may be a realistic short-term target. A 20 percent cut in mining cost that requires fleet replacement is a very different ask.
This is also where cross-functional review becomes important. The analysis should be discussed with site operations teams, not just finance or strategy. The people closest to the work often know immediately whether a benchmark gap reflects a real performance issue or a structural factor the dataset does not fully capture. CosMO workflows are useful here because they help teams compare like with like without losing sight of what is happening on the ground.
Step 4: Turn Benchmarks into Executive Dashboards and Ongoing Performance Reviews
A benchmarking exercise that lives in a spreadsheet and gets shown once is a missed opportunity. The value comes from embedding it into regular performance reviews and making it visible to the leaders who can act on it.
Executive dashboards for mining cost benchmarking should follow a few simple principles:
Clarity over completeness. Leadership does not need every normalized data point. They need to know where the operation sits relative to peers, which cost components are most out of line, and whether the gap is widening or narrowing. A clean one-page view with traffic-light indicators and trend lines is usually more useful than a dense table.
Consistency in methodology. Benchmarks only earn trust if they are updated the same way each cycle. If the peer group changes, the normalization method changes, or the cost scope changes, those shifts need to be flagged clearly. Otherwise, it is hard to tell whether the movement reflects actual performance or just a change in method.
Integration with operational KPIs. Benchmarking is far more useful when it sits alongside metrics like equipment availability, ore recovery, and contractor productivity. When the cost data and operational KPIs point in the same direction, and cost lines such as taxes remain clearly classified in executive views where relevant, the diagnosis becomes much more credible.
A cadence that supports decision-making. Quarterly updates are common for operating cost benchmarks. Capital cost benchmarks for projects may be reviewed at key gate points. The timing should follow the decisions being made, not just the pace of data collection.
Over time, a well-maintained benchmarking framework becomes a real strategic asset. It supports capital allocation, M&A due diligence, contractor negotiations, and continuous improvement programs. The same dashboards can also help validate supplier contracts and ongoing expenses over time. The upfront effort to build it properly, from peer selection through normalization and reporting, pays off across all of those use cases.
For organizations standardizing the workflow, mining benchmarking tools can support ongoing review and cross-functional visibility.
Frequently Asked Questions
What is mining cost benchmarking?
Mining cost benchmarking is the structured comparison of a mine’s financial and operational metrics against external reference points, such as industry averages, commodity-specific datasets, regional benchmarks, or peer company results.
Which mining cost metrics should teams benchmark?
Common metrics include all-in sustaining cost AISC, C1 cash cost, sustaining capital, unit operating costs, and capital intensity. Each metric shows a different part of cost performance, from site-level efficiency to project development competitiveness.
Why is cost normalization important in mining benchmarking?
Raw cost data is rarely comparable without adjustment. Teams need to normalize for scope, geography, mining method, commodity mix, cost definitions, and reporting boundaries so comparisons are genuinely like for like.
How do mine cost curves support capital allocation?
Mine cost curves show where an operation sits relative to other producers in the same commodity market. That helps leadership understand margin resilience, downside risk, and whether capital should be directed toward growth, sustaining work, acquisitions, or shareholder returns.
How can AI improve mining cost benchmarking?
AI can support cost forecasting, scenario analysis, and productivity benchmarking when the right data structure and governance are in place. It helps teams work through larger datasets, identify cost variances sooner, and compare performance with more confidence.
Ready to Take the Next Step?
If you’re exploring modern cost estimation platforms, check out Nomitech’s full suite or get in touch with our team to find the right fit for your workflows.





Stay Up to Date
Subscribe to our Newsletter today and receive the latest updates, trends, expert insights, and exclusive offers tailored to your specific industry.