

BIM Benchmarking Workflow: Measure Maturity & Performance
TL;DR: A BIM benchmarking workflow helps project teams measure whether BIM is improving coordination, cost control, risk management, handover quality, and long-term asset performance. By defining baselines, tracking meaningful KPIs, and reviewing performance across the full asset lifecycle, leaders can turn BIM from a modeling activity into a measurable business capability.
Define the BIM Benchmarking Workflow: Scope, Outcomes, and Lifecycle Coverage
Cost estimates, model data, and project decisions move quickly. Often faster than teams can properly check them. When BIM workflows are fragmented, estimators, project managers, designers, and delivery teams can end up working from different assumptions. That makes cost control harder and weakens trust in the numbers.
The pressure is not easing. Bids are tighter, scopes keep expanding, and project data is scattered across models, spreadsheets, cost systems, and project controls tools. A BIM benchmarking workflow gives leaders a structured way to see how BIM is actually performing across planning, design, construction, handover, and operations. It helps separate real improvement from extra process that only looks productive.
This article explains how to define BIM benchmarking, choose useful KPIs, assess BIM maturity, and connect model performance to business outcomes. It also shows where tools such as CostOS can help teams bring model data, cost intelligence, and workflow visibility into one controlled process. The first step is getting clear on what the workflow needs to measure.
What a BIM Benchmarking Workflow Measures
A lot of teams still judge BIM by model quality alone. Clash detection rates. LOD compliance. File coordination accuracy. Those are important, but they do not tell the whole story.
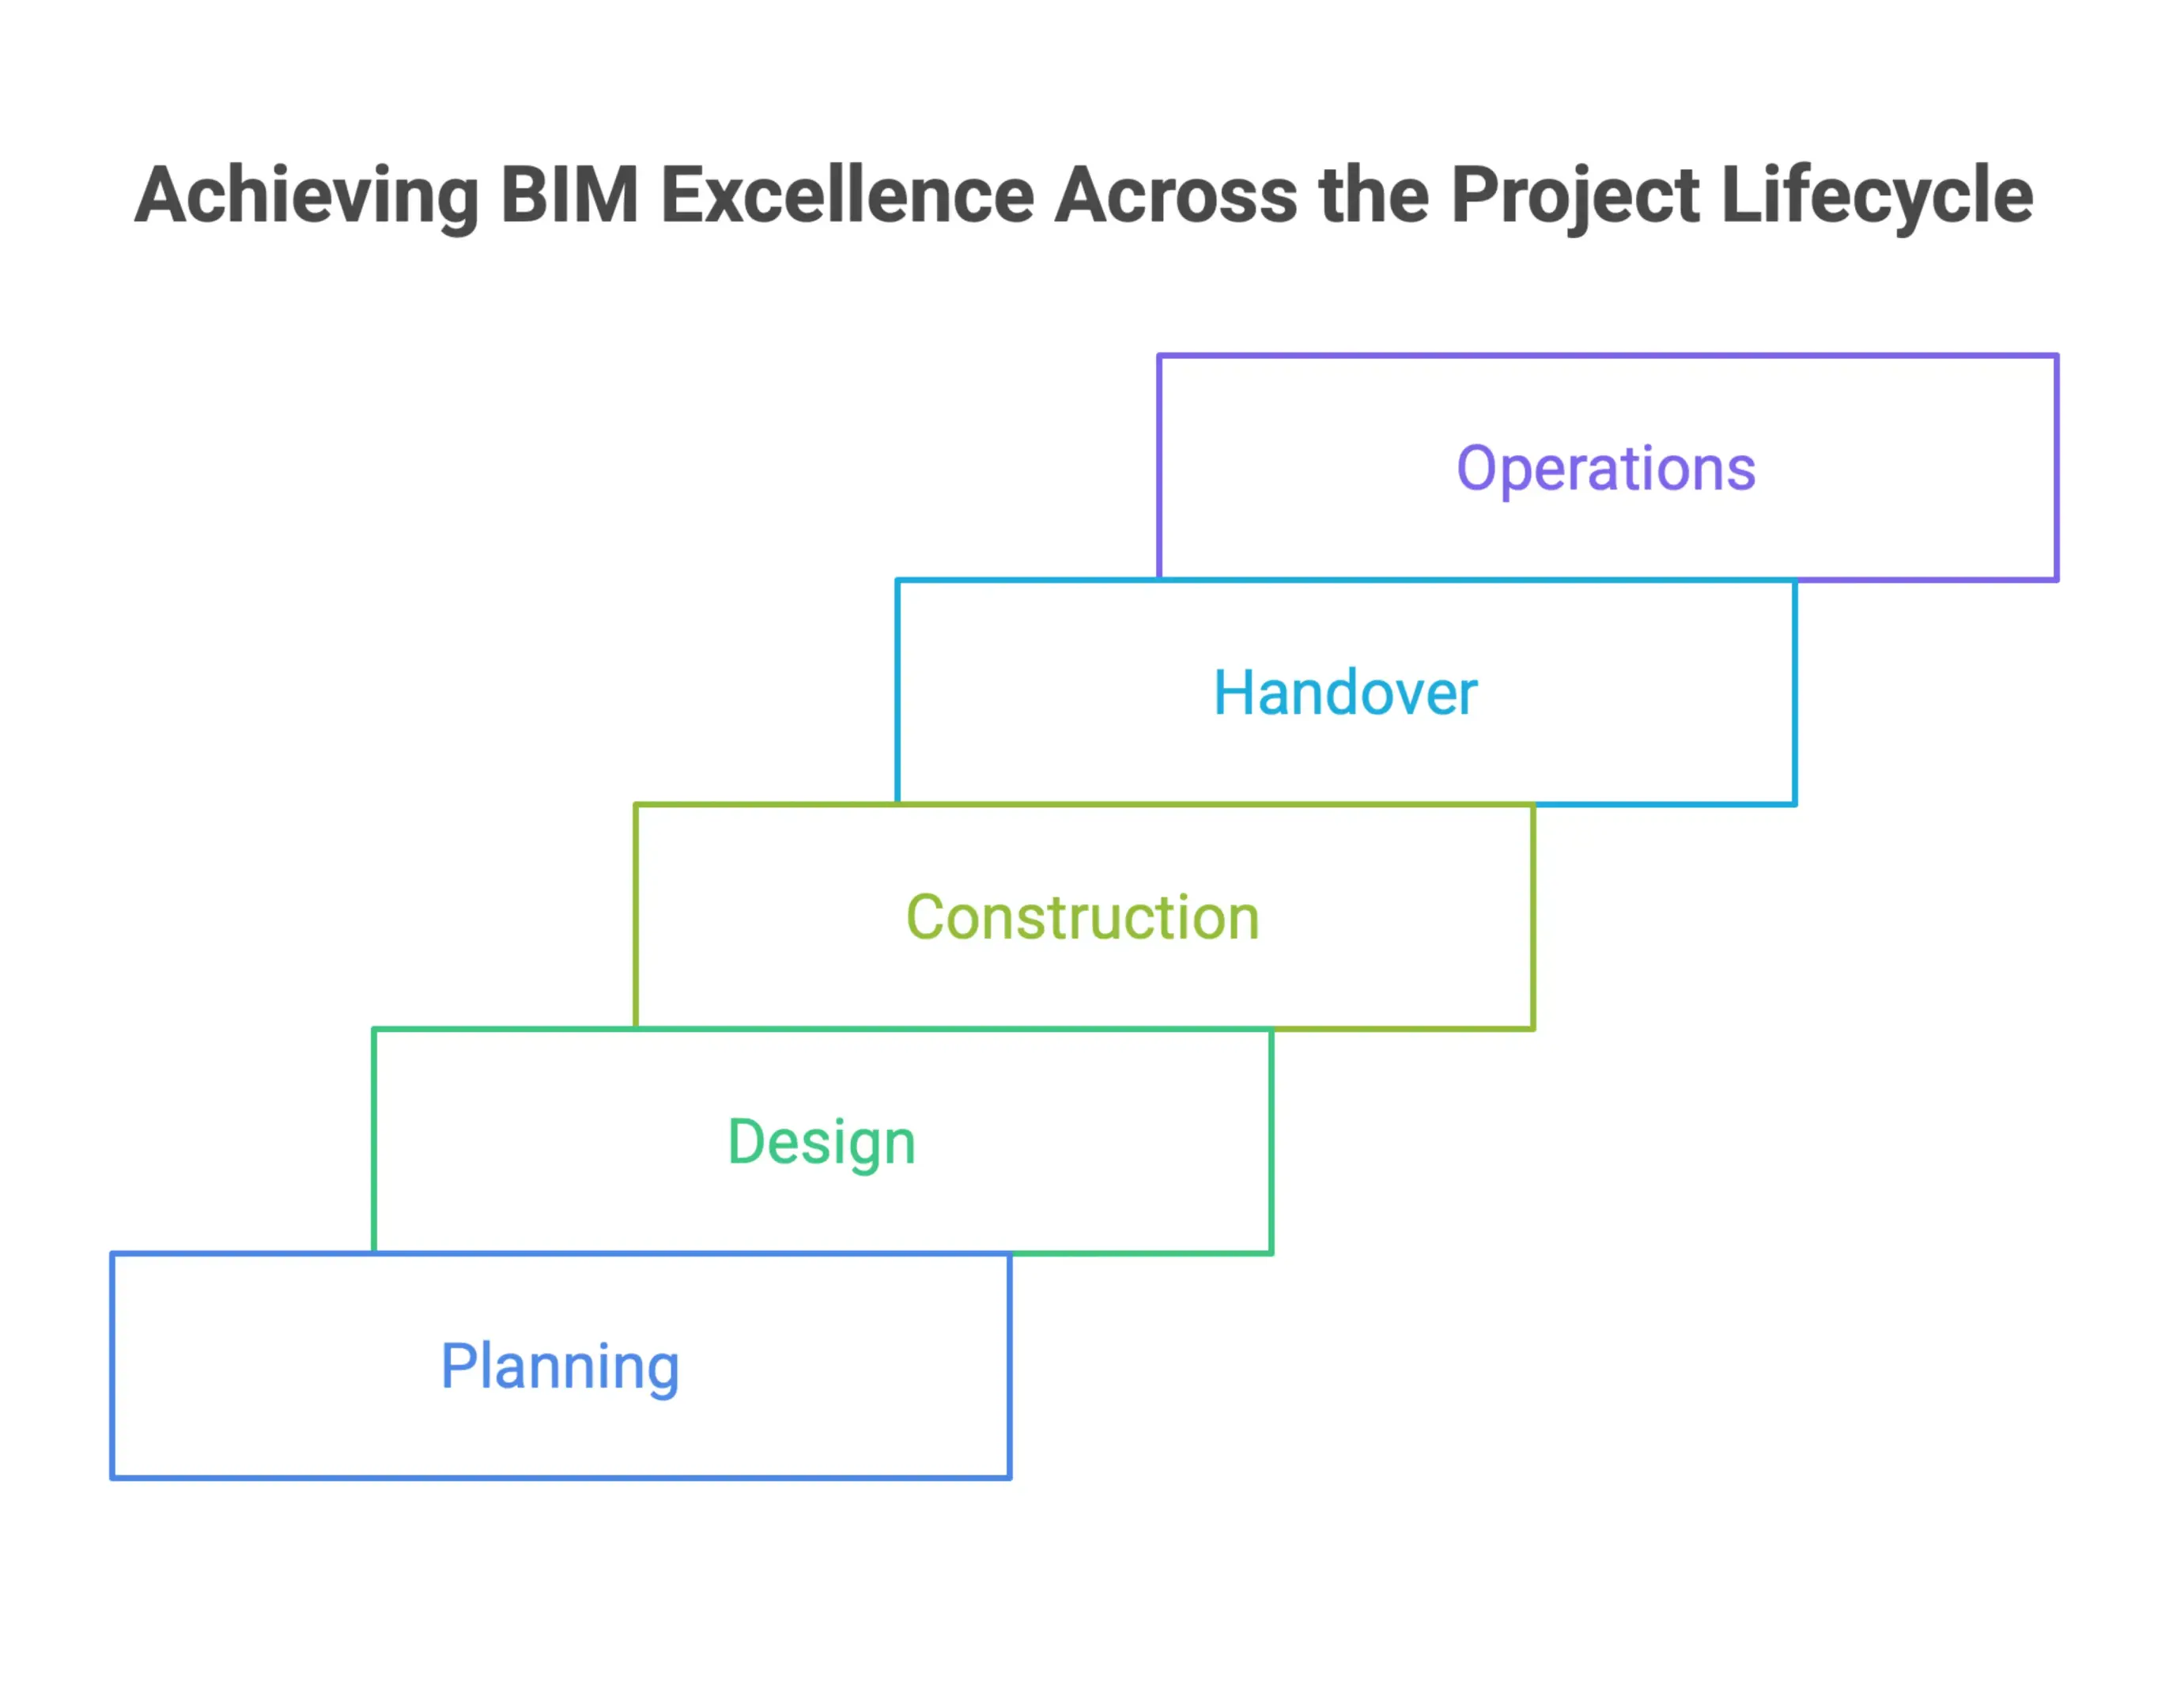
A strong BIM benchmarking workflow looks at performance across the full project lifecycle and the broader BIM workflow:
- Planning: Is building information modeling helping teams test feasibility and align stakeholders early, or is it being introduced too late to influence decisions?
- Design: Are BIM models and information modeling workflows reducing rework, improving collaboration, and shortening review cycles?
- Construction: Is the model being used on site in a practical way, and is it improving construction workflows, schedule performance, and resource planning?
- Handover: Are deliverables organized so the asset owner receives accurate, usable project information?
- Operations and service management: Is the model maintained as part of the asset record, or does it get parked once practical completion is reached?
The Federal Highway Administration describes BIM for highway infrastructure as a collaborative digital process that runs through planning, design, construction, and service management. Just as importantly, the FHWA commissioned benchmarking work to compare U.S. practice with countries where BIM is more mature. That matters because it shows benchmarking is not just a compliance exercise. It is a research method for understanding where current practice stands and where it needs to improve.
The same thinking applies at project and organizational level. A BIM benchmarking workflow should give a clear view of performance across every lifecycle phase, not just the areas where modeling activity is easiest to measure. It should also account for project data, model context, and the information exchange that happens between teams.
Why Decision-Makers Need Benchmarks Before Scaling BIM
Scaling BIM without a baseline is an easy way to burn time and budget. Teams buy software, train people, and change workflows, but if no one has defined what success looks like, there is no reliable way to know whether the effort is paying off.
For senior project managers, EPC leaders, and infrastructure delivery teams, benchmarks are useful for a few practical reasons:
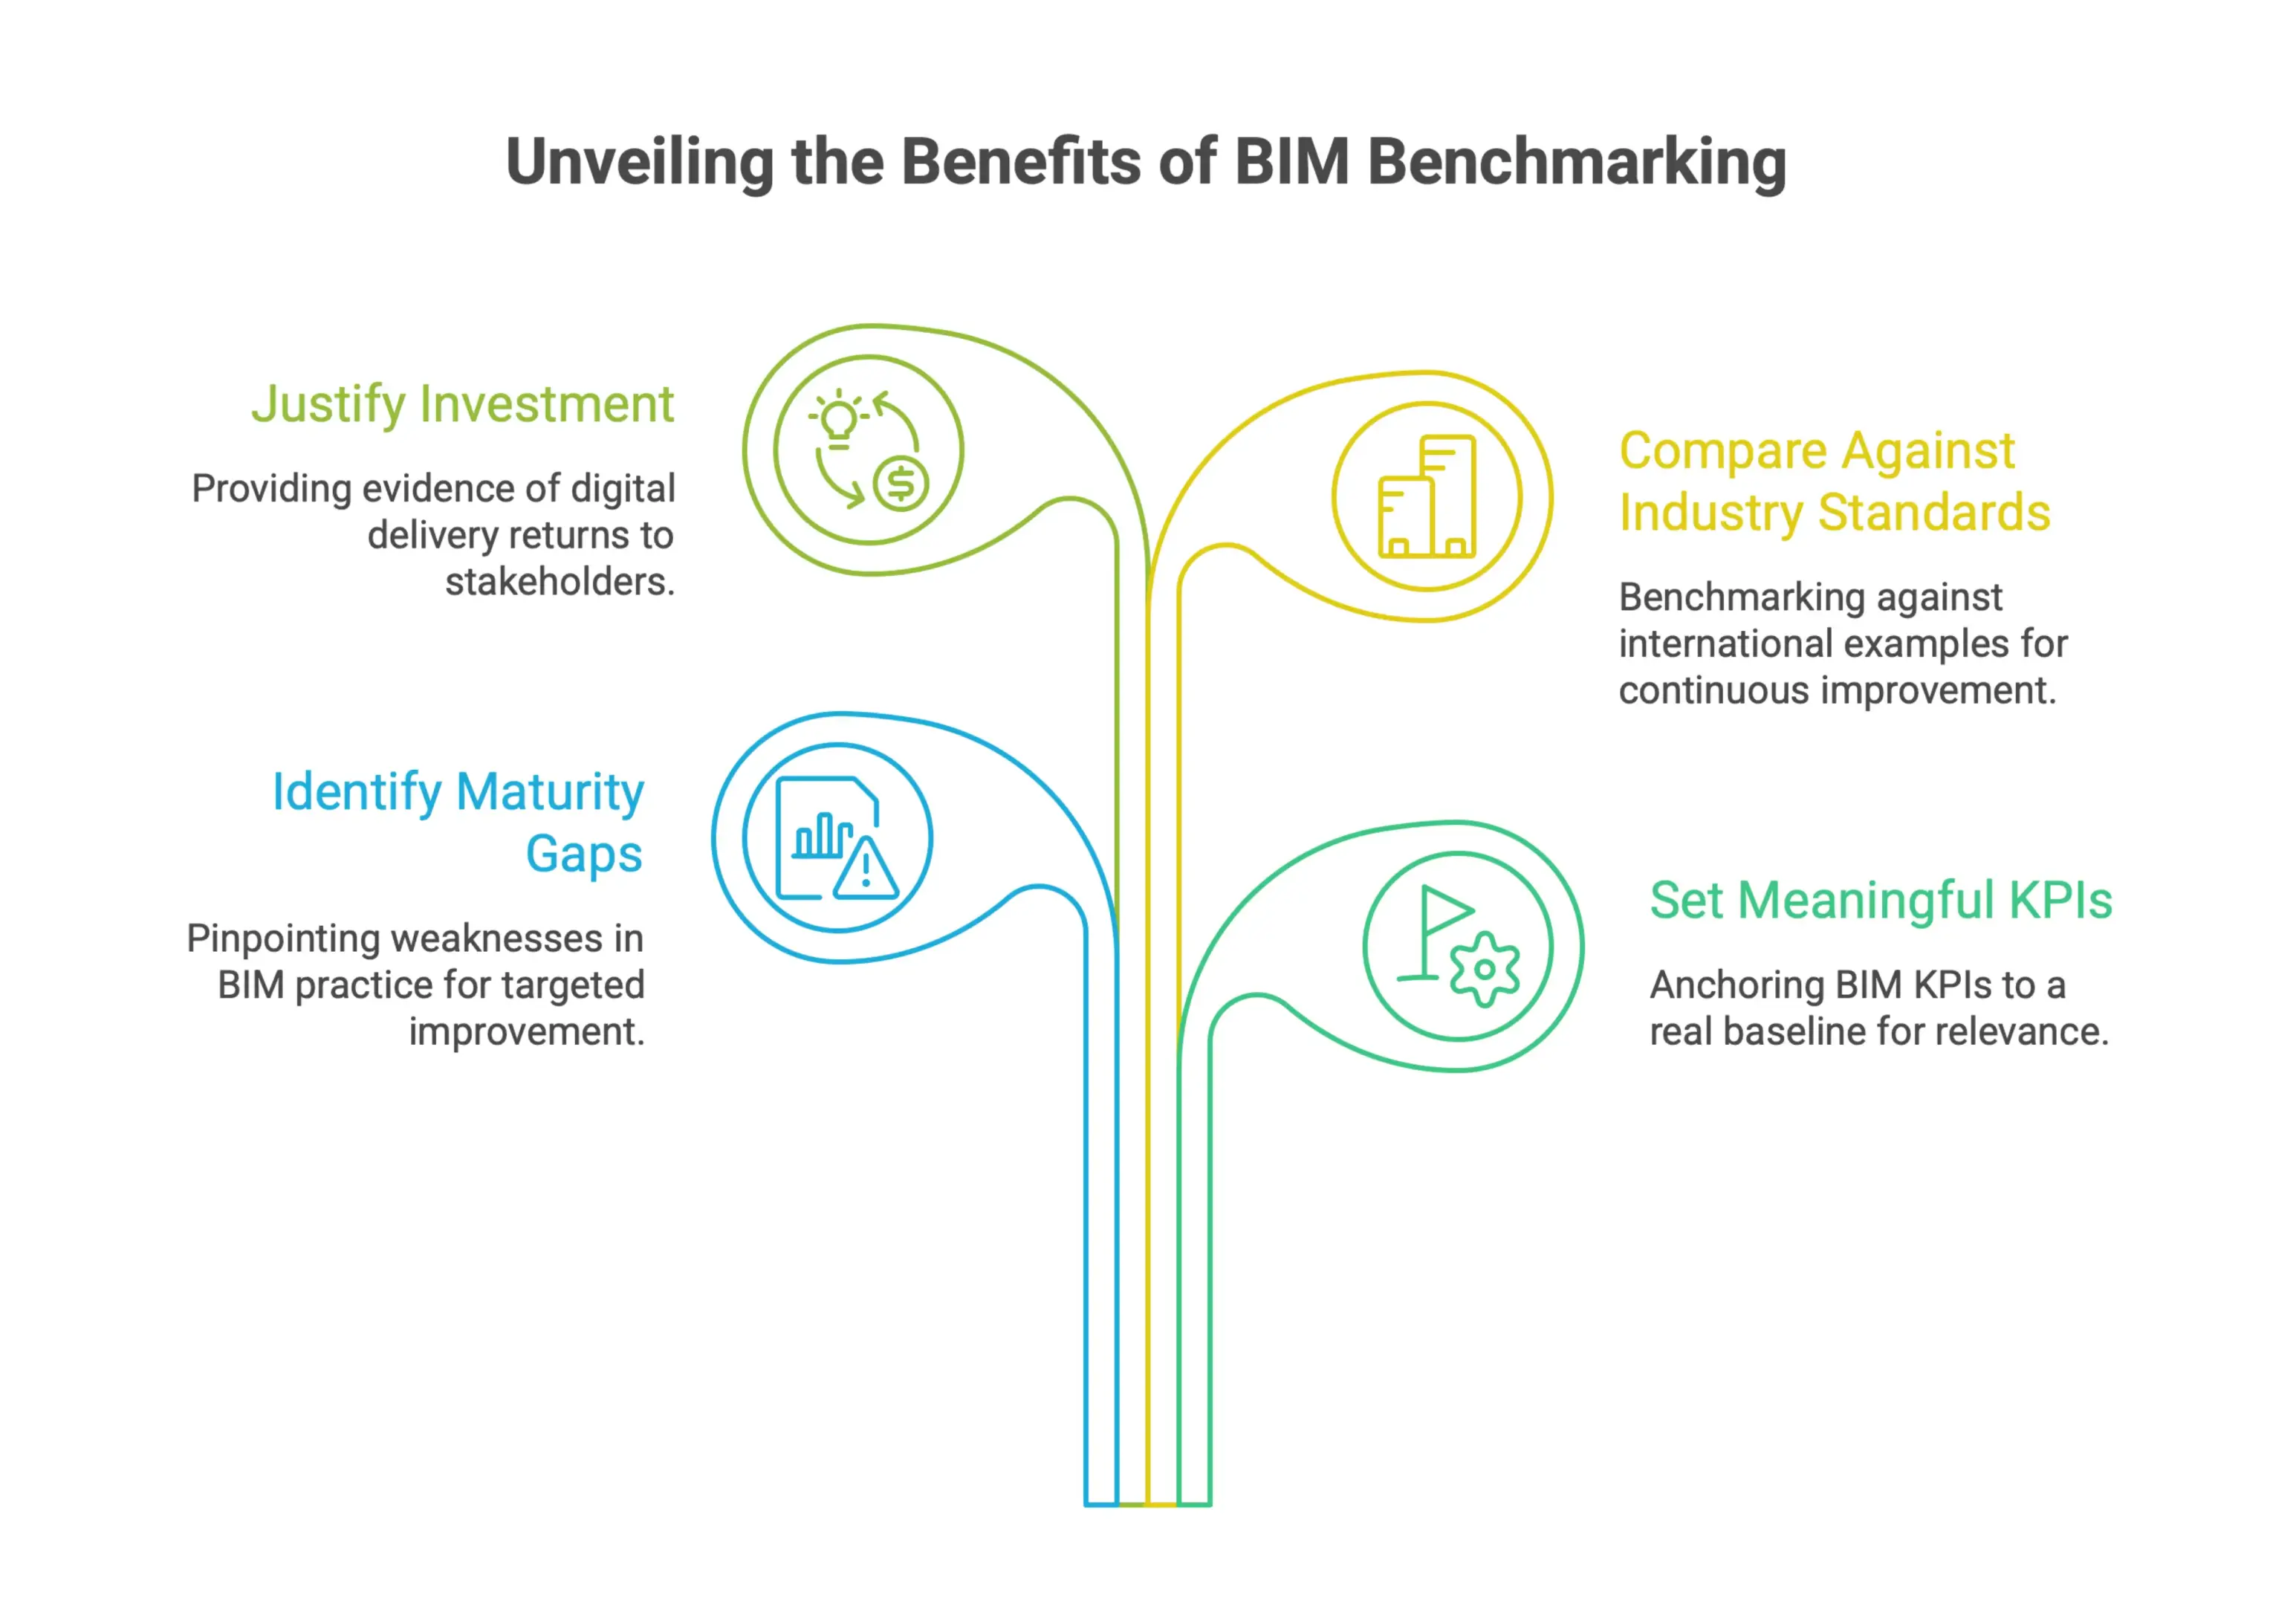
- To spot maturity gaps before they become delivery risks: A benchmark shows where current BIM practice is weak, whether the issue is process, technology, or capability. That gives teams a clearer place to focus investment.
- To set KPIs that mean something: BIM KPIs only work when they are anchored to a real baseline. Benchmarking provides that starting point.
- To justify investment with evidence: Clients and executives increasingly want measurable returns from digital delivery. Benchmarks make those returns easier to prove.
- To compare against industry standards: The FHWA's work benchmarking U.S. highway BIM practice against more mature international examples is a useful reminder that benchmarking is about comparison, not just self-assessment.
The Federal Highway Administration report makes this point clearly at a national scale. The same logic applies inside any organization. Before expanding BIM into more projects or phases, leaders need an honest view of current performance. That includes the quality of BIM models, the consistency of BIM execution plan requirements, and the usefulness of information exchange during delivery.
Core SEO Concepts to Cover: BIM Benchmarking, BIM Maturity, BIM KPIs, and BIM Workflow Optimization
To understand a BIM benchmarking workflow properly, four connected ideas need to be clear. These are more than search terms. They describe different parts of BIM performance.
BIM Benchmarking
BIM benchmarking is the process of measuring current BIM performance against a defined standard, previous results, or external comparators. As the Federal Highway Administration shows, useful benchmarking needs to cover delivery and operations together, not just model outputs. It depends on clear metrics, consistent measurement methods, and a scope that spans the full project lifecycle.
BIM Maturity
BIM maturity describes how developed and embedded an organization's BIM capability is. At lower maturity levels, BIM is often used in isolated ways with limited collaboration. At higher levels, it is built into workflows, team coordination, and project delivery. Benchmarking shows where an organization sits on that curve and what the next step should be.
BIM KPIs
BIM KPIs are the specific measures used to track performance within a benchmarking framework. These might include model coordination cycle times, data completeness at handover, or the share of site decisions supported by BIM outputs. The best KPIs are tied to lifecycle outcomes, not just the number of models produced.
BIM Workflow Optimization
Workflow optimization means improving the efficiency, consistency, and outcomes of BIM-related processes. Benchmarking supports that work by showing which workflows are underperforming and where the biggest gains are likely to be. Without benchmarking data, optimization tends to be reactive. With it, teams can make changes based on evidence.
Together, these four ideas move the conversation beyond software features and into real organizational performance, project delivery, and long-term asset value. They also help teams evaluate whether building information modeling BIM is actually improving construction and facility operations.
Establish the Business Case: Reduce Risk, Delays, and Cost Overruns
For project leaders, the pressure to deliver on time and within budget never really lets up. But delays and cost growth are not always caused by dramatic failures. More often, they come from smaller workflow issues that go unnoticed until they start showing up in the schedule and the budget.
That is where BIM benchmarking earns its place in project governance. By tracking how BIM workflows are actually performing, teams get a clearer view of where problems are forming. It becomes easier to step in early, manage risk before it spreads, and create accountability across the project.
How Small BIM Workflow Issues Compound Into Major Project Impacts
One of the most overlooked realities in construction project management is how quickly small inefficiencies pile up. A delay in coordination here, a late model handover there, and before long the programme has slipped and the contingency budget is under pressure.
According to Autodesk Construction, construction teams should measure and quantify workflows because even small errors and delays can snowball into bigger schedule and cost impacts. That is not just theory. It is a pattern that shows up again and again on complex projects.
In a BIM environment, that compounding effect can look like this:
- A model is delivered late to a subcontractor, which pushes fabrication drawings back
- Clashes stay open because review cycles do not have a clear cadence
- Rework builds downstream as design intent drifts from site conditions
- Programme float disappears, and what started as a coordination gap turns into a critical path issue
Benchmarking helps break that cycle. Once teams have measurable baselines for BIM workflow performance, they can see where friction is building before it starts affecting delivery. That is especially useful when BIM workflow issues create costly rework across disciplines and packages.
Benchmarking as a Risk Management Tool for Owners, Contractors, and Design Leads
Construction risk is often discussed in terms of procurement, ground conditions, or supply chain disruption. BIM workflow performance carries its own risks too, and those risks affect every group involved in the project.
For owners, weak BIM execution reduces schedule certainty and makes cost forecasting less reliable. For contractors, poor model quality that goes untracked can lead to rework and contractual disputes. For design leads, workflow gaps can mean incomplete information exchange, slower coordination, and delayed sign-off.
Autodesk Construction frames benchmarking as a practical way to improve process performance, and that is a useful way to think about it. It moves benchmarking out of retrospective reporting and into active risk management. When teams know where their workflows stand against a defined baseline, they can focus attention and resources where the exposure is highest.
That becomes especially important on large, multi-discipline projects where BIM responsibilities are spread across several organizations. Without consistent measurement, each party works from assumptions about how well the workflow is performing. Benchmarking replaces those assumptions with data. Tools such as Nomitech’s enterprise cost management suite can support that kind of structured visibility without making the process more complicated than it needs to be.
Translating BIM Performance Metrics Into Board-Level Outcomes
One of the biggest challenges in BIM governance is the gap between technical metrics and executive decision-making. Project sponsors and board-level stakeholders are usually not focused on model coordination rates or clash detection volumes. They care about delivery confidence, financial exposure, and reputational risk.
That is where BIM benchmarking becomes genuinely useful. It turns technical performance data into evidence leadership can act on:
- Is the project still on track for key programme milestones?
- Are cost controls holding up under current workflow conditions?
- Where are the unresolved process risks that could affect closeout?
As Autodesk Construction notes, measuring and quantifying workflows is the starting point for understanding and improving construction performance. For senior stakeholders, that means benchmarking data can support clearer status reporting, better go or no-go decisions, and tighter oversight of delivery teams.
The strongest project organizations treat BIM benchmarking as more than a technical exercise. They use it as a governance tool that connects day-to-day workflow performance to the schedule certainty and cost control that executive leadership is ultimately responsible for. They also use it to evaluate software platforms, collaboration routines, and automation opportunities in a consistent way.
Assess BIM Maturity: Move Beyond Project Checklists
A BIM project checklist can make progress feel visible. But on its own, it does not tell you whether the organization is actually improving its BIM capability over time. Checklists show what got done. A maturity assessment shows whether the team is getting better at doing it. That difference matters when you are trying to build a repeatable BIM workflow across teams and projects.
To benchmark BIM in a useful way, organizations need a structured way to evaluate the full picture: how people work, how processes are defined, how technology is used, and how well information holds up in real project conditions. That includes BIM models, project information, and the information modeling standards used to build and exchange them.
Using BIM Maturity Models to Evaluate Capability
Maturity models give organizations a clear framework for understanding where they are now and what progress should look like. Instead of asking, “Did we use BIM on this project?” they ask a better question: “How well are we using BIM, and how consistently?”
One established example is bimSCORE, which the National Institute of Building Sciences National BIM Standard documentation describes as an interactive, scalable decision dashboard for evaluating BIM maturity. The important point is that bimSCORE is designed to assess maturity, not just check compliance project by project.
That kind of dashboard helps teams:
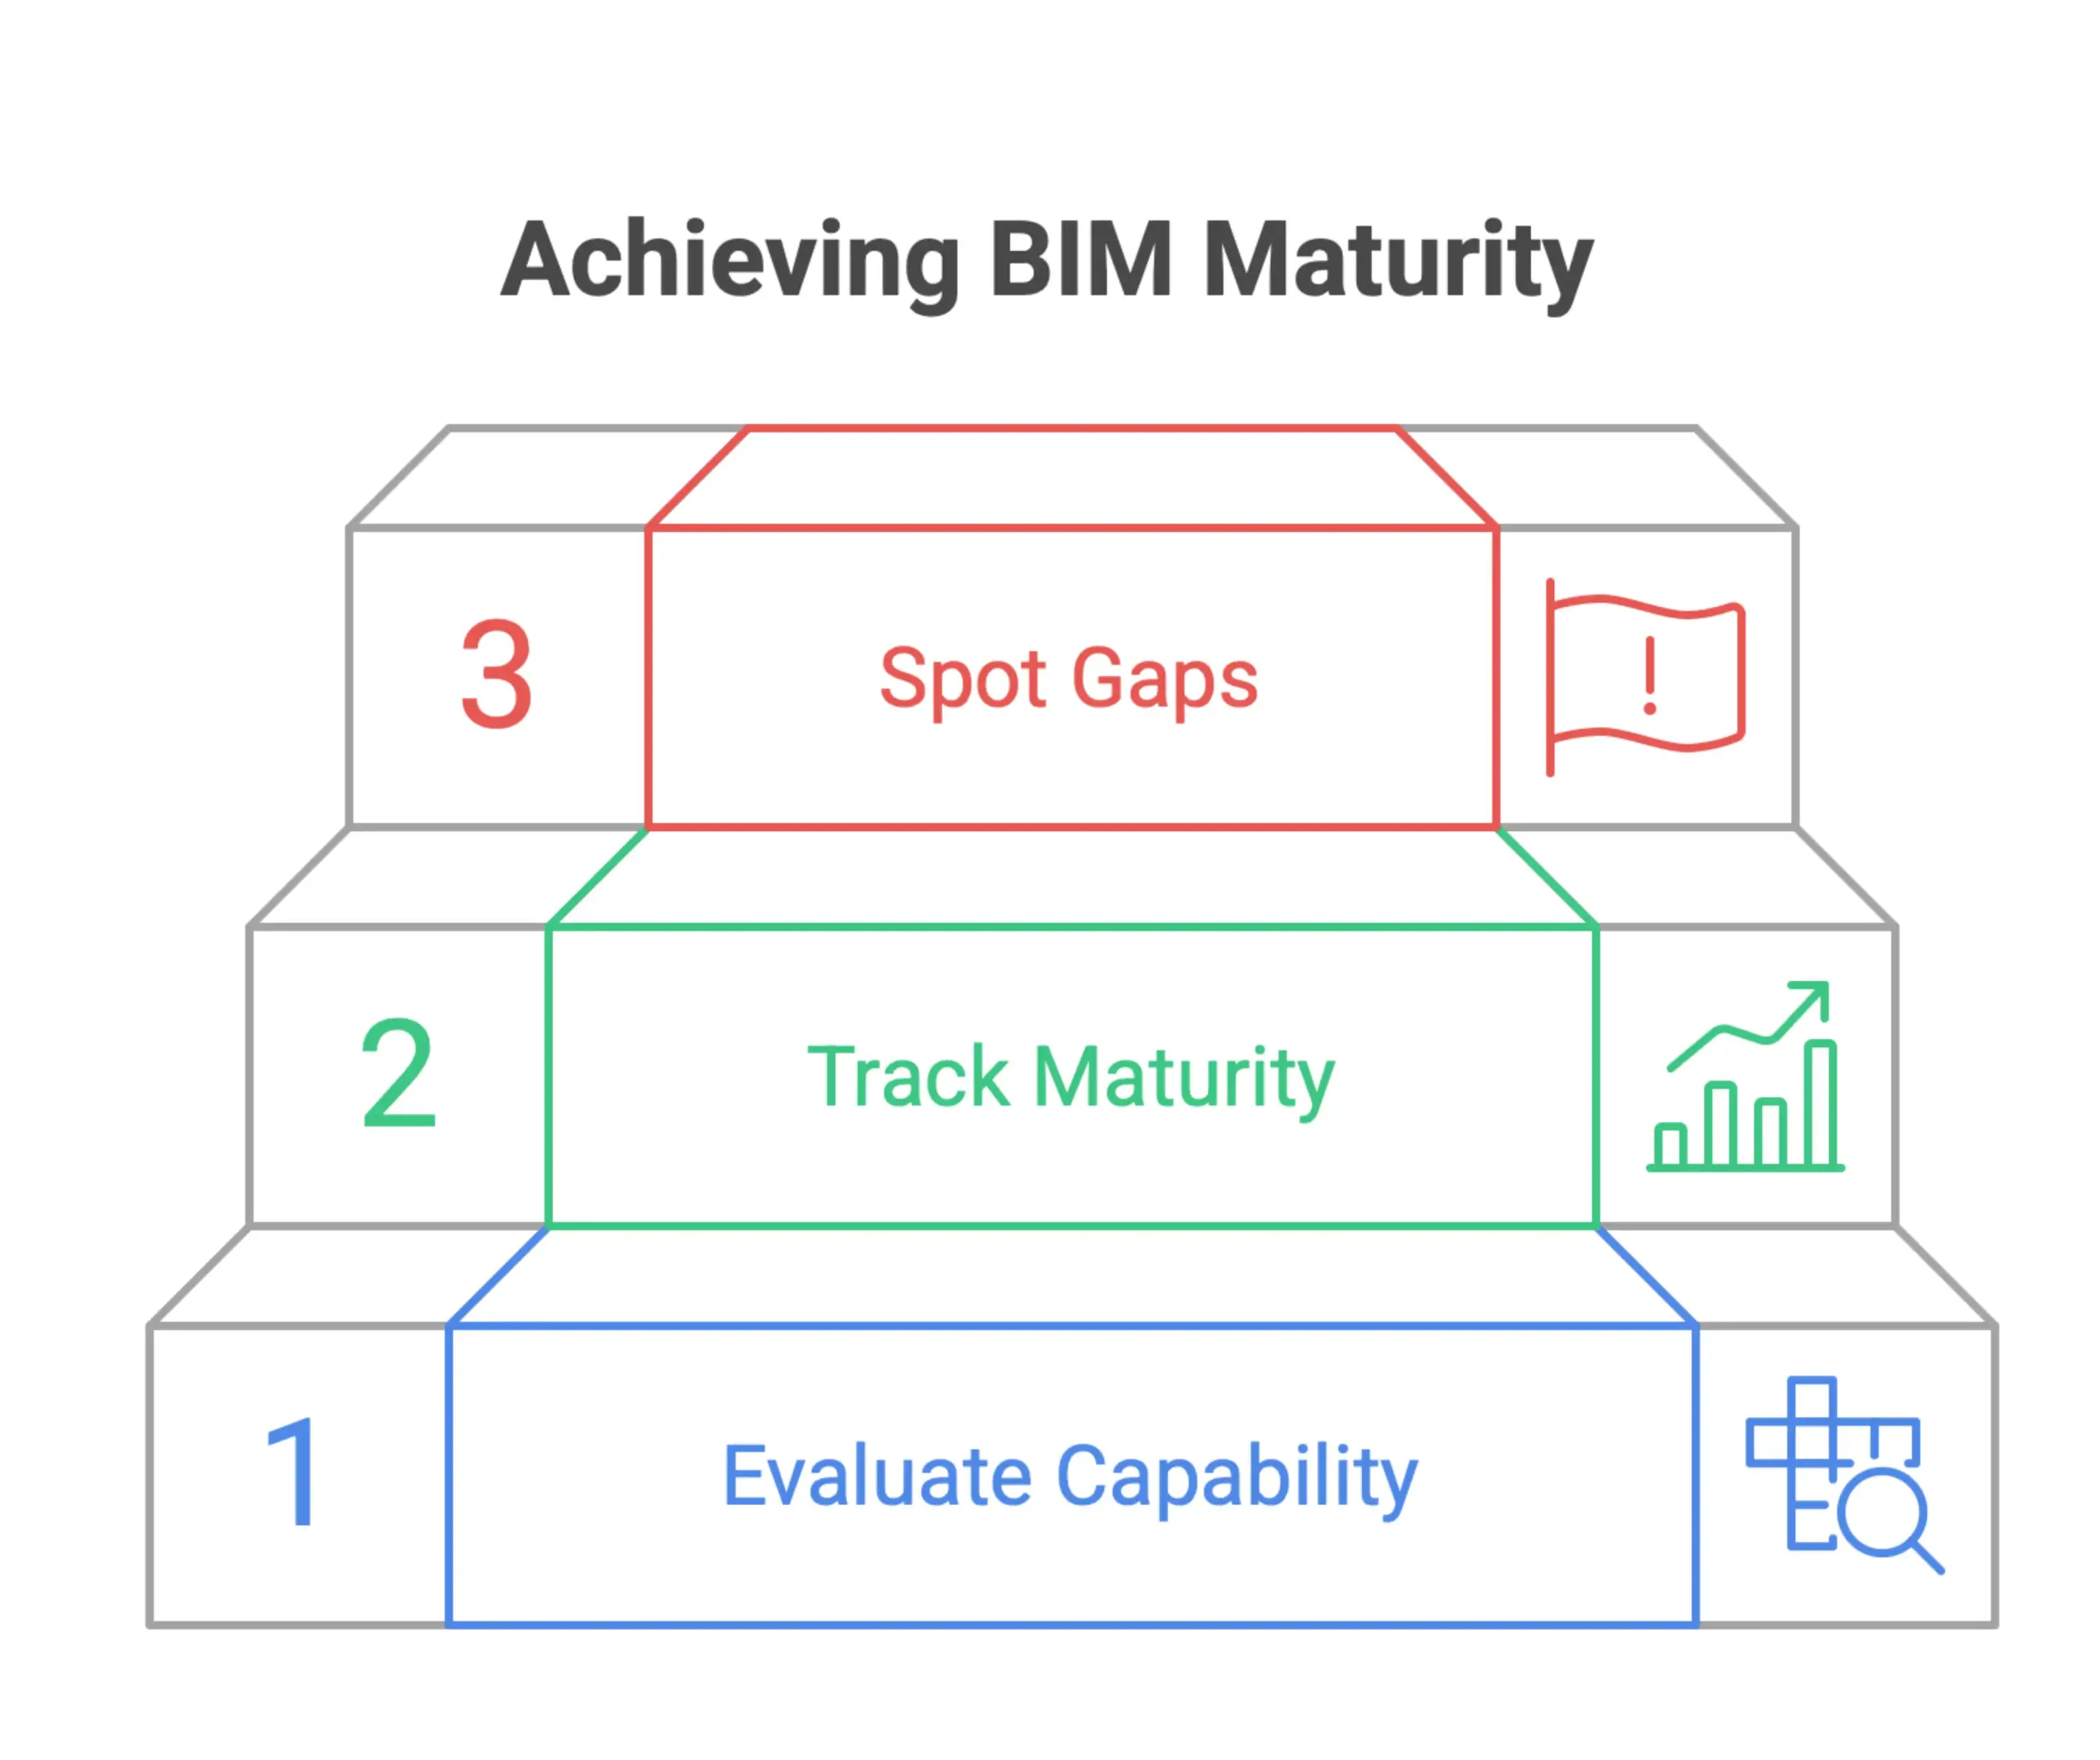
- Evaluate BIM capability at the organization level, not just on individual projects
- Track maturity over time using repeatable scoring criteria
- Spot capability gaps early, before they turn into delivery problems
Once maturity models become part of a benchmarking workflow, the focus shifts from reacting to issues to building capability deliberately. In the construction industry, that shift is often what separates a widely adopted BIM program from one that never moves past a proof of concept.
Benchmarking People, Process, Technology, and Information Quality
A solid BIM benchmark should look at four areas: the people doing the work, the processes they follow, the technology they rely on, and the quality of the information being created and exchanged.
If you only look at one of those areas, you get a partial view. A team may have strong software in place but weak modeling standards. Or the process may be well documented, but training has not kept up with new tools. Good benchmarking makes those gaps visible.
The National Institute of Building Sciences describes bimSCORE as a scalable decision dashboard, which fits this broader way of thinking. A useful evaluation tool has to account for different levels of BIM adoption across teams, project types, and organizational structures. One fixed standard rarely works everywhere.
When benchmarking across these dimensions, it helps to evaluate:
- People: Role-specific BIM skills, training frequency, and how consistently teams adopt the workflow
- Process: Whether BIM execution plans are standardized and actually followed across projects
- Technology: Software interoperability, version control, and how effectively the tools are being used
- Information quality: Model accuracy, data completeness, and reliability of exchanges between teams
Scoring each area separately gives leadership a much clearer view of where investment will make the biggest difference. It also helps teams coordinate trades, reduce costly rework, and make sure design intent survives into the construction phase.
Creating a Baseline Score Before BIM Transformation
Before any BIM transformation starts, you need a baseline. Without one, it is hard to tell whether changes are working or to make a strong case for continued investment in process improvement.
A baseline score captures the current state of BIM capability across the organization using consistent, repeatable criteria. It becomes the reference point for every future assessment.
Tools like bimSCORE, as described by the National Institute of Building Sciences, support this approach by giving teams an interactive framework they can revisit at defined intervals. Because the dashboard is designed to scale, it can work for a single business unit or an enterprise-wide rollout.
Setting a baseline before transformation:
- Creates accountability by clearly documenting the starting point
- Helps prioritize improvement work based on actual gaps, not assumptions
- Supports a stronger case for leadership investment in BIM capability
A baseline is not a judgment. It is a starting point. Organizations that take the time to establish one are in a much better position to build a BIM benchmarking workflow that delivers measurable improvement over time. They can also compare project data more reliably across construction operations and facility operations.
Build the Governance Framework: Policies, Standards, Change, and Tools
A BIM benchmarking workflow only works when it sits inside a governance structure that can hold up across projects, teams, and asset portfolios. Without that backbone, benchmark data gets fragmented, metrics lose context, and improvement becomes hard to sustain. This section explains what that structure looks like in practice.
Separate Governance, Adoption, Process, and Technology Metrics
One of the clearest lessons from organizations that have scaled BIM well is that not every metric belongs in the same bucket. As Arup shows in its BIM business transformation framework, implementation can be organized into four distinct areas: policies and strategies, change management, standards and processes, and integrated BIM technology.
Using that same approach for benchmarking keeps the picture much clearer. Instead of blending everything together, you track:
- Governance metrics that show whether policies exist and are actually being followed
- Adoption metrics that reveal how teams are using BIM in day-to-day work
- Process metrics that measure workflow efficiency, coordination quality, and delivery consistency
- Technology metrics that assess tool performance, data interoperability, and model health
Keeping those categories separate makes it easier to find the real problem. A weak adoption score points to a different issue than a coordination bottleneck or a software integration failure. This is where BIM workflow visibility and model information quality start to matter as much as the models themselves.
Define BIM Standards, Naming Conventions, and Model Exchange Requirements
Benchmarking is only as reliable as the data behind it. If teams are working from inconsistent rules, the numbers will never be fully trustworthy. That is why clear BIM standards need to be in place before benchmarking can deliver much value.
In practice, that means documenting and enforcing:
- Naming conventions for files, elements, and parameters so data can be compared across projects without manual cleanup
- Model exchange requirements that define expected formats, level of detail, and metadata at each project stage
- Information delivery standards that set how benchmark data is collected, reviewed, and shared
Again, the Arup framework treats standards and processes as a separate workstream for a reason. It is not just a byproduct of software selection or governance policy. When this layer is clearly defined, the rules for model quality and data structure stay consistent instead of shifting from project to project.
Without it, benchmarks built on uneven inputs can point teams in the wrong direction. Clear BIM execution plan requirements also help keep expectations aligned through design development, construction workflows, and handover.
Assign Ownership for Benchmark Data, Reviews, and Continuous Improvement
A governance framework without ownership is really just a document. If BIM benchmarking is going to drive improvement, specific people need to be accountable for specific outcomes.
That usually means assigning responsibility for:
- Benchmark data collection and quality so someone is always accountable for accurate, current inputs
- Scheduled reviews at the project, program, and portfolio level so benchmarks are actually used, not just reported
- Continuous improvement cycles where findings feed into updated standards, training, or tooling decisions
The change management side of the Arup framework makes this especially clear. Organizational change does not happen through policy alone. It needs steady ownership and a clear process for acting on what the benchmarks are telling you.
In practice, that often means giving a BIM manager or information manager direct responsibility for benchmark governance, with project leads supporting the review cycle and feeding in the data. The structure does not need to be complicated. It does need to be explicit. Many teams use Autodesk Construction Cloud or similar software platforms to keep benchmark tasks, reviews, and project information in one place.
Select the Right BIM KPIs: Metrics That Prove Workflow Performance
Choosing the right KPIs is usually the point where BIM benchmarking either starts to work or quietly loses momentum. If the metrics are vague, teams end up measuring activity that does not really show how the project is performing. The right KPIs connect model quality, coordination efficiency, delivery timelines, and long-term asset value in a way that supports real decisions. This section breaks down the four metric categories that should anchor any serious BIM benchmarking workflow.
Model Quality Metrics: Completeness, Accuracy, Clash Density, and Data Consistency
Model quality is the base layer for everything that follows. If the model is incomplete, inaccurate, or built inconsistently, every process built on top of it inherits those problems. That is why quality metrics should be set early and monitored throughout the project, not just checked at handover.
The four dimensions worth measuring are:
- Completeness: The percentage of required model elements that are present and populated against the defined project scope
- Accuracy: How closely model geometry and embedded data match design intent and real-world conditions
- Clash Density: The number of hard, soft, and workflow clashes per discipline or model zone, measured across coordination review cycles
- Data Consistency: Whether shared parameters, naming conventions, classification codes, and property sets are applied uniformly across all contributing models
Tracking clash density over time is especially useful because it shows whether coordination is actually improving from one review cycle to the next. A high clash count early on is normal. A high clash count late in the process usually points to a workflow breakdown, not just a model issue.
Data consistency matters beyond internal QA too. When BIM models are used for cost estimation, facility management, or procurement, inconsistent attribute data creates rework at every handover point. Tools like Nomitech's BIM rendering engine can help teams keep that data structured in a way that supports downstream use instead of creating extra cleanup later.
Workflow Efficiency Metrics: Review Cycles, Rework, RFIs, and Approval Time
Efficiency metrics show how well the BIM process holds up under real project pressure. These are the numbers that connect model maturity to schedule performance and day-to-day team productivity.
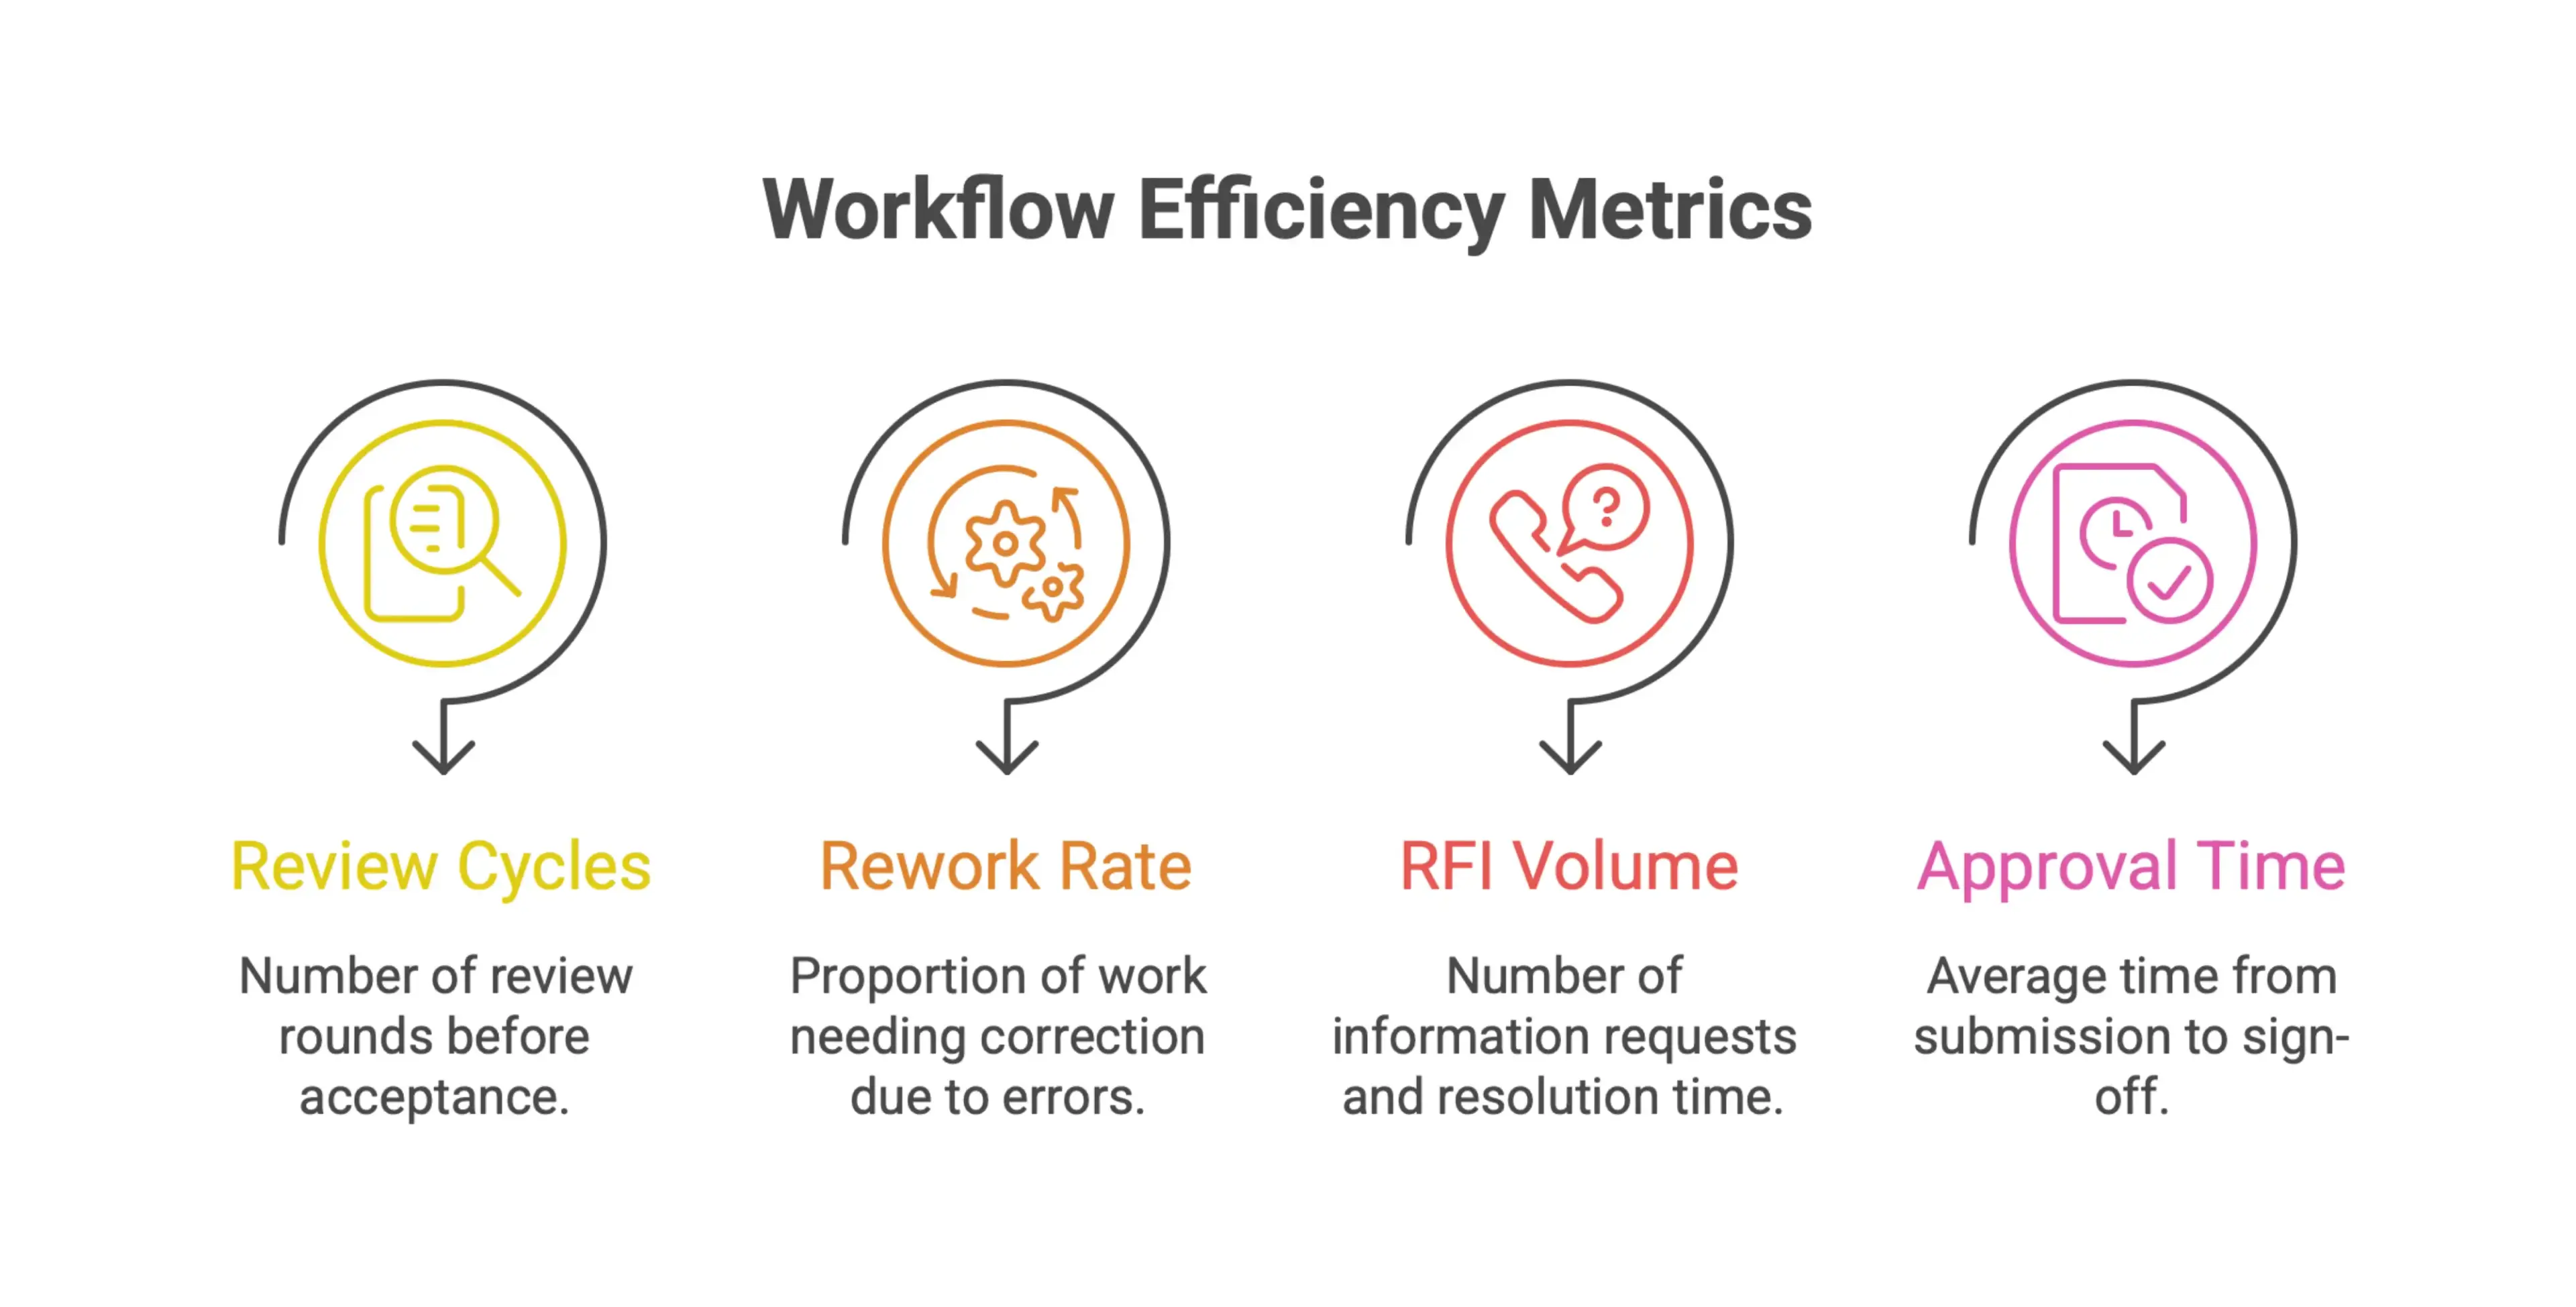
Key metrics to track in this category include:
- Review Cycles per Deliverable: How many rounds of review are required before a model, drawing, or document package is accepted
- Rework Rate: The proportion of completed work that requires correction or redesign as a result of model errors or coordination failures
- RFI Volume and Resolution Time: The number of requests for information raised against BIM deliverables, and how quickly they are resolved
- Approval Time: The average time elapsed between submission and sign-off for key BIM milestones
High RFI volumes tied to specific model zones or disciplines usually point to where coordination is breaking down. If approval cycles stay long across the board, the problem may not be the model itself. It may be the review process, the communication flow, or LOD expectations that were never aligned from the start.
These metrics are most useful when tracked by phase, discipline, and project type. Over time, that creates a baseline you can compare against, which makes future benchmarking far more meaningful. It also helps evaluate whether ifc models and building information modeling outputs are ready for downstream construction and facility operations.
Commercial Metrics: Cost Variance, Schedule Variance, and Productivity Gains
BIM benchmarking becomes more valuable across the wider organisation when it ties back to commercial outcomes. This is the category that matters most to stakeholders outside the BIM team, because it shows whether better workflows are actually improving project results.
The three core commercial metrics are:
- Cost Variance: The difference between budgeted and actual project costs, analysed in relation to BIM maturity, coordination quality, and the timing of clash detection
- Schedule Variance: The deviation from planned project milestones, with attention to whether delays correlate with BIM process gaps, late information delivery, or change events driven by coordination failures
- Productivity Gains: Measurable improvements in output per team resource, such as reduced hours spent on rework, faster drawing production, or more efficient procurement driven by model data
One of the clearest commercial arguments for early clash detection is cost avoidance. Problems caught in the model are far cheaper to fix than the same problems discovered on site. When teams benchmark the volume and timing of clash resolution against project cost outcomes, they get hard evidence for why coordination workflows matter.
Productivity gains can be harder to pin down, but comparing resource hours across similar projects with different BIM maturity levels gives teams a practical way to measure improvement over time. That is particularly important in the construction industry, where even modest gains can have a meaningful impact on margins.
Adoption Metrics: User Participation, Standards Compliance, and Training Effectiveness
Even a well-designed BIM framework will deliver limited value if the people expected to use it are not actually engaged. Adoption metrics show whether the process is being followed in practice across the project team, not just documented on paper.
Three adoption indicators are worth monitoring consistently:
- User Participation Rate: The proportion of team members actively contributing to and using the common data environment, model authoring tools, and coordination platforms relative to the total project team
- Standards Compliance Rate: How consistently project participants apply agreed BIM standards, including naming conventions, file structures, LOD requirements, and data templates
- Training Effectiveness: Whether team members who have completed BIM training are applying that knowledge correctly in their day-to-day workflows, measured through audit findings, error rates, or competency assessments
Low participation rates often mean BIM tools are being used in pockets rather than as part of the full workflow. When only part of the team works inside the model, coordination benefits shrink and data quality starts to break down in the gaps.
Standards compliance becomes even more important in multi-discipline projects where several firms or subcontractors contribute models. If everyone follows slightly different rules, every integration point becomes harder than it needs to be. That also weakens the reliability of the data being passed into cost planning, procurement, or facilities management.
Tracking these metrics gives project leaders an early warning system. It is a much better way to spot adoption gaps before they turn into coordination failures or commercial problems. It also helps evaluate whether software platforms are enabling better collaboration or just adding more tasks.
Expand the Benchmark Across the Asset Lifecycle
A BIM benchmarking workflow that only looks at model quality during design leaves a lot of value on the table. If you want a program that truly shows how BIM is performing, it needs to follow the asset through the full lifecycle, from early design decisions through construction, handover, and operations. Without that wider view, teams often end up measuring the wrong things.
Measure BIM Performance From Design Through Construction and Monitoring
BIM is no longer just a design tool. According to Federal Highway Administration research, BIM adoption in highway projects is growing steadily across design, construction, and condition monitoring phases. That shift matters for benchmarking too. If BIM is being used in more places, the benchmark has to cover more ground.
When benchmarking stops at model completeness in the design stage, it misses how BIM value changes once the project moves into construction and then into monitoring. A more complete workflow tracks:
- How well design intent carries through to construction-ready deliverables
- Whether BIM outputs are actually used in the field, not just stored away
- How condition monitoring data connects back to the original model over time
Each stage reflects a different kind of performance, so each one needs its own criteria. In the construction phase, that means checking if BIM models help coordinate trades and reduce time consuming updates. In operations, it means checking whether model information supports maintenance and planning.
Include Handover Readiness and Asset Information Quality
One of the biggest gaps in BIM benchmarking is the handover phase. Teams put a lot of effort into models during design and construction, but the quality of information handed over to asset owners often goes unmeasured.
Handover readiness benchmarking asks a different question than design quality checks. It looks at whether the right information is structured properly, tagged clearly, and easy for operations and maintenance teams to use. When asset information is incomplete or messy at handover, the cost shows up later. And it is rarely cheap to fix.
For infrastructure work especially, where assets may stay in service for decades, the quality of handover information affects the return on every BIM investment made earlier in the process. Benchmarking that treats handover as a formal stage helps make sure the model stays useful after construction. Not just as a record, but as a working source of asset information.
That is why as built BIM should be measured alongside BIM models created during design and construction. The output is only valuable when it supports construction and facility operations with reliable project information.
Benchmark BIM for Infrastructure, Buildings, and Capital Programs Differently
Not every BIM program should be measured the same way. Infrastructure projects, commercial buildings, and large capital programs all come with different delivery models, stakeholder groups, and information needs.
The Federal Highway Administration research focuses on BIM in highway infrastructure, which shows how different the priorities can be from vertical construction. Highway projects involve linear assets, long service lives, and condition monitoring needs that do not map neatly to a typical building project.
A benchmarking workflow that applies the same yardstick to every project type will usually produce metrics that are either too vague or too narrow to act on. A better approach is to define benchmark criteria around:
- The asset type and its operational demands
- The delivery model in use
- The stakeholders responsible for long-term management
Capital programs add another layer of complexity. They often include multiple projects running in parallel under one governance structure. In that setting, benchmarking has to work at both the project level and the program level so teams can track consistency and performance across the portfolio, not just within one asset.
That is also where information modeling becomes more useful. It gives teams a better model context for comparing project data across multiple phases and organizations.
Connect BIM Benchmarking to Digital Twins and Operations
BIM benchmarking does not need to end at project handover. When it is set up properly, the benchmarks established during design and construction become the baseline for how an asset is monitored and managed throughout its operational life. This section looks at how to extend BIM benchmarking into digital twin readiness, operational performance tracking, and continuous improvement across future projects.
Use BIM Benchmarks to Prepare for Digital Twin Performance Tracking
A digital twin is only as strong as the data behind it. If your BIM models do not contain consistent, benchmarked information on geometry, asset attributes, system classifications, and performance expectations, the twin will struggle to produce anything useful.
That is where BIM benchmarking becomes essential. By setting clear quality thresholds during the project lifecycle, you create structured, reliable data that can flow into a digital twin environment at handover.
According to Arup, digital twins have the potential to improve operational efficiency, strengthen asset management, reduce costs, and support better productivity and safety. But those gains depend on having clean, consistent asset data in place before the twin goes live.
In practical terms, your BIM benchmarking workflow should cover:
- Asset attribute completeness, so operational systems can identify and query components without missing data
- System-level performance baselines, so live performance can be measured against a clear reference point
- Naming conventions and classification standards that transfer cleanly from the model into the operations platform
Teams that treat BIM benchmarking as a digital twin prerequisite are in a much better position at handover than teams that try to fix data quality later. They also have a clearer path for construction and facility operations once the project is complete.
Track Operational KPIs: Maintenance Efficiency, Asset Reliability, and Safety
Once a project enters operations, the purpose of BIM benchmarks shifts. They move from delivery assurance to performance measurement. The standards you set during design and construction become the benchmark for judging how the asset is actually performing in the field.
Arup's digital twin framework points to operational efficiency, asset management improvement, and safety as key areas where digital twins can create measurable value. For BIM benchmarking teams, that translates into a practical set of post-handover KPIs to watch:
- Maintenance efficiency: Are assets being maintained at the intervals and standards defined in the model? If not, that can point to gaps in how asset data was captured or handed over.
- Asset reliability: Are systems performing within the tolerances set during design? Tracking reliability against the original BIM benchmark helps facilities teams separate design issues from operational problems.
- Safety performance: Where safety-critical systems were benchmarked during construction, ongoing monitoring can surface risks before they turn into incidents.
These are not abstract metrics. They are direct extensions of the work your team has already done. The important part is making sure operations teams can access the original benchmarks and use them as a practical reference for day-to-day decisions.
That is especially true when facility operations teams need to compare current conditions with the original information exchange set during project delivery. It is also where asset data and project information need to remain usable long after handover.
Close the Feedback Loop Between Operations Data and Future BIM Standards
One of the most overlooked opportunities in BIM benchmarking is the feedback loop between operational performance and future project standards. Many organizations treat handover as the end of the process. In reality, it should mark the start of a data collection phase that improves every project that follows.
When operational data shows that certain benchmarks were too loose, too strict, or simply did not match how the asset behaves in use, that insight is valuable. It should feed directly into the next project in the portfolio.
As Arup notes, digital twins can improve asset management over the long term. To make that improvement repeatable, not accidental, organizations need a clear way to feed operational findings back into BIM benchmarking standards.
In practice, this means:
- Reviewing operational performance data at set intervals and comparing it with project benchmarks
- Identifying where benchmark thresholds failed to reflect real-world conditions and updating standards accordingly
- Documenting lessons learned in a format that BIM and project delivery teams can use on future work
This kind of feedback loop turns BIM benchmarking from a project-level quality check into a broader asset management capability. Over time, it improves the quality of your benchmarks, strengthens the reliability of your digital twins, and creates a clearer link between how assets are modeled and how they actually perform over their life cycle. It also gives teams a practical way to evaluate performance gaps across future projects.
Future-Proof the Workflow: Benchmark AI-Assisted BIM and IFC Data Editing
BIM workflows are moving quickly. AI-assisted model editing, natural-language instructions, and IFC-based automation are no longer distant ideas. They are already starting to shape how teams work with building data at scale. If benchmarking is going to stay useful, it has to keep up.
This section looks at how to extend your BIM benchmarking workflow so it accounts for AI-enabled editing, IFC data integrity, and automation readiness. The goal is simple: make sure your evaluation process reflects how modern BIM tools actually perform.
Benchmark AI-Assisted Model Editing for Accuracy and Consistency
As AI tools take on more model editing work, benchmarking has to go beyond visual checks and manual review. The real question is no longer just, "Did the model update?" It is, "Did the AI understand the instruction correctly, and did the result match what was actually intended?"
Research in this area is already heading that way. arXiv published a 2026 study that introduced a structured benchmark built specifically for IFC-based BIM model editing. It includes 324 natural-language editing tasks, which means AI tools are tested on whether they can read plain instructions and turn them into accurate model changes.
For teams building or evaluating BIM workflows, that approach is worth following:
- Define editing tasks in clear, natural-language terms
- Check whether AI outputs match the expected model state
- Test across different instruction types to see where accuracy starts to slip
Consistency matters just as much as correctness. One successful edit does not tell you much. A benchmark across hundreds of varied tasks gives you a far better picture of how reliably an AI tool performs under real conditions. It also helps teams see whether artificial intelligence is actually improving BIM workflow performance or just adding another layer of complexity.
Measure IFC Data Integrity Across Create, Update, and Delete Operations
IFC sits at the center of open BIM interoperability, so any workflow that touches model data needs to keep IFC files clean and structurally sound throughout the editing process.
The benchmark introduced by arXiv covers three operation types: creating new model elements, updating existing ones, and deleting components. That breakdown matters because each operation brings its own data integrity risks.
When benchmarking IFC data handling, it makes sense to evaluate each operation separately:
- Create operations: Are new elements added with the right attributes, relationships, and IFC schema compliance?
- Update operations: Do changes carry through correctly without damaging linked data or breaking the model hierarchy?
- Delete operations: Are removals clean, or do broken relationships and orphaned references remain in the file?
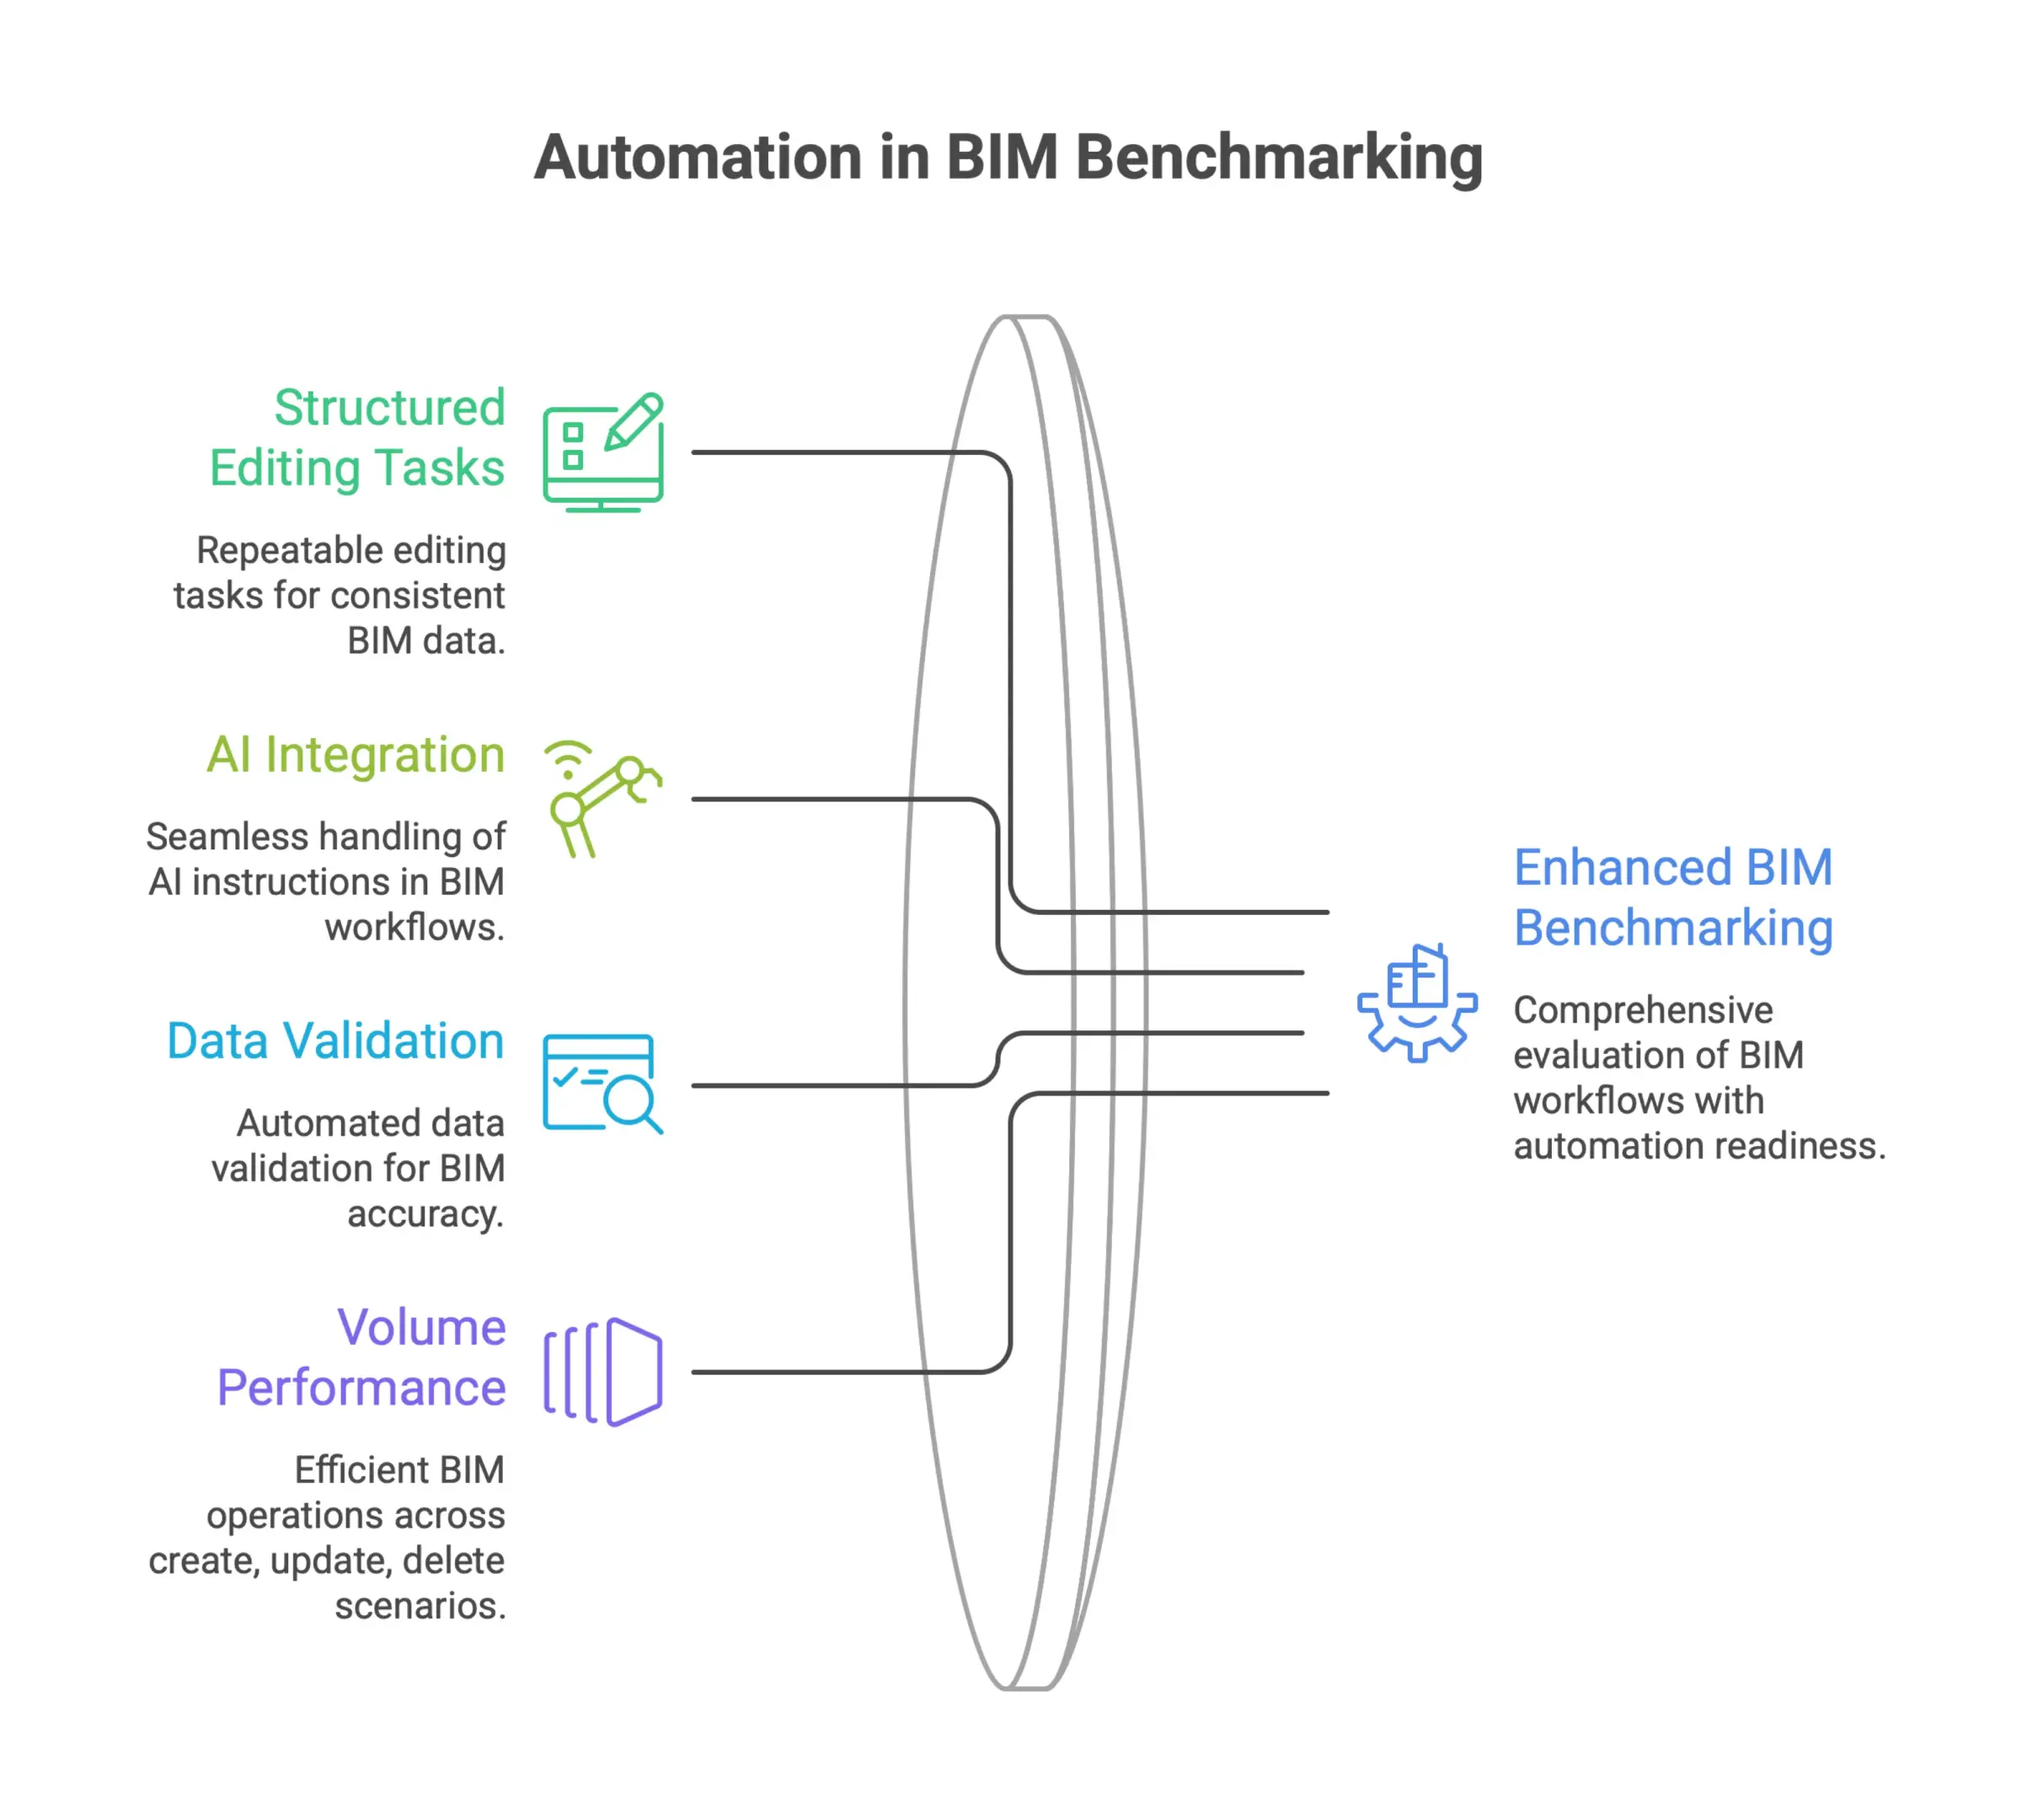
Treating these as separate test categories gives you a much clearer view of how robust a workflow or tool really is. A system that handles creates well but leaves residue behind after deletions is still a problem in production. This is where industry foundation classes and ifc models become critical to benchmark quality.
Add Automation Readiness to the BIM Benchmarking Scorecard
Most BIM benchmarking scorecards already focus on model accuracy, coordination quality, and data completeness. Those still matter. But as automation becomes a bigger part of how BIM data is created and maintained, the ability to support automated workflows should have a place on the scorecard too.
The work referenced by arXiv treats BIM editing as something that can be structured, tested, and evaluated systematically. That is exactly what automation readiness depends on. If a workflow can be described in natural language, broken into discrete steps, and checked against expected outcomes, it is also a workflow that can be automated and benchmarked at scale.
When you add automation readiness to your scorecard, track things like:
- Whether editing tasks can be defined in structured, repeatable formats
- How well the workflow handles AI-generated instructions versus manual inputs
- Whether data validation is built into the process or left to a manual review step afterward
- How the workflow performs across create, update, and delete scenarios at volume
Teams that build these criteria into benchmarking now will be in a much better position to evaluate new tools, introduce automation gradually, and catch quality issues before they turn into project-level problems. That is especially relevant for the AEC industry, where software, technologies, and methods are changing quickly.
Benchmark Scan-to-BIM, Point Clouds, and Existing Conditions
A useful future-proofing step is benchmarking how well teams handle scan-to-BIM tasks, especially when point cloud data is used to capture existing conditions. Current geometric metrics often struggle to assess component-level accuracy, so teams need a process that goes beyond visual comparison.
That is where point cloud workflows matter. They can support building elements, structural elements, and mep systems when the model context is clear and the data collection process is controlled. For as built BIM work, you need high fidelity outputs, geometric accuracy, and topology metrics that help evaluate whether the resulting ifc models are actually reliable.
This is also where a single tool usually is not enough. Teams often need a combination of software, analysis methods, and knowledge to assess topological correctness, semantic information, and element ids across complex models. In adaptive reuse projects, the challenge becomes even greater because existing conditions are often incomplete and construction teams must reconcile model information with reality on site.
OpenBIM also matters here. IFC is a widely adopted format for interoperability, and openBIM promotes transparency and reproducibility in research. That makes it easier to benchmark ifc files across software platforms and compare workflows without locking the process into one vendor.
Benchmark AI and Scan to BIM Research With Real Datasets
AI technologies can improve scan to BIM reconstruction efficiency, but only if the benchmark data is realistic enough to train on. That is one reason large, domain-specific datasets are so important. BIMNet is the first openBIM-based dataset for scan to BIM, and it contains over 116.5 million points from 25 real-world scans across more than 8,700 square meters and 382 rooms.
That scale matters because existing datasets often focus on household items, not building elements. BIMNet supports AI-based training for over 20 organizations and gives researchers a stronger basis for evaluating scan to BIM tasks. For the AEC industry, it offers a more relevant proof of concept for benchmarking reconstruction methods and improving performance.
It also addresses a broader research need. Benchmarking data collection is laborious and error-prone, and BIM-based benchmarking lacks a consistent approach for reliable data. Historical benchmarking helps set reference baselines for project performance, while lessons learned from completed BIM projects should feed into future project planning. The result is better methods, better analysis, and better performance over time.
If teams want to evaluate these technologies properly, they should not rely on visual inspection alone. They should measure how the workflow handles project data, ifc files, computer vision outputs, and overall model information quality at scale.
Implement the BIM Benchmarking Workflow: A Step-by-Step Roadmap
Getting a BIM benchmarking workflow up and running is not just a technical task. It takes alignment across teams, a clear view of what you are measuring and why, and a willingness to act on what the data shows. The roadmap below breaks the process into three practical phases and calls out the common mistakes that can derail even well-meaning efforts.
Step 1: Define Objectives, Stakeholders, and Benchmarking Scope
Before you collect a single data point, the team needs to agree on what success actually looks like. That means setting clear, measurable objectives that tie BIM performance to real project outcomes, whether that is fewer coordination issues, faster model delivery, or less rework.
Just as important is identifying the right stakeholders early. BIM benchmarking cuts across design leads, project managers, BIM coordinators, and often procurement or cost engineering teams. If one of those groups is missing, the framework usually reflects only part of the picture.
Scope is where many teams either try to take on too much or stay too vague. A practical starting point is to focus on two or three workflows or project phases instead of attempting to benchmark everything at once. That keeps the first rollout manageable and gives the team an early result to build on.
Key actions at this stage include:
- Documenting the specific BIM workflows you intend to measure
- Assigning ownership for data collection and reporting within each team
- Establishing a shared definition of each metric so results are interpreted consistently across the organization
A good BIM execution plan helps here because it defines standards, responsibilities, and coordination frequency before work starts. It also gives the project team a better framework for aligning BIM workflow tasks with delivery expectations.
Step 2: Capture Baseline Data and Prioritize High-Impact Workflows
Once the objectives and scope are clear, the next job is establishing a baseline. This is the reference point for every future comparison, so accuracy matters more than speed here.
Baseline data should come from existing project records, model audit logs, issue trackers, and any QA or clash detection reports already in use. The goal is to capture performance as it really is, not as teams assume it is. That gap between perception and reality is common, and the baseline is where it becomes visible.
After that, the focus shifts to prioritization. Not every workflow carries the same weight. A good filter is to ask which workflows, if improved, would have the biggest impact on cost, schedule, or quality. High-frequency workflows, areas with heavy coordination dependency, and tasks with a history of rework are usually the best candidates.
This step also makes it easier to justify continued investment internally. When you can show that a specific workflow is driving a measurable share of coordination overhead or delay, it becomes much easier to secure the time and resources needed to improve it.
Practical steps at this stage:
- Pull raw data from at least two to three completed projects for a reliable baseline
- Map each workflow to a project outcome it directly influences
- Rank workflows by impact potential and ease of measurement
- Document data sources and collection methods so the process is repeatable
If teams already use Autodesk Construction Cloud, they can often centralize issue logs, model reviews, and project information in a more consistent way. That helps reduce time consuming manual collection and keeps the workflow closer to real-time.
Step 3: Review Results, Standardize Improvements, and Re-Benchmark Regularly
Benchmarking only matters if it leads to action. Once you have the initial results, the review process should be structured and consistent. Set up formal review sessions with the relevant stakeholders, and keep the conversation centered on workflow performance, not broad project commentary.
When a workflow shows clear room for improvement, the next move is standardization. That means updating templates, protocols, or model standards so the better approach becomes part of the default process instead of depending on individual effort. This is where a one-time fix turns into something the organization can actually sustain.
Regular re-benchmarking keeps the workflow relevant over time. For most organizations, a quarterly or per-project review cycle works well. The key is to treat each re-benchmark as a direct comparison against the baseline and any interim targets, not just a status check.
Over time, this review, standardize, and re-benchmark cycle builds a feedback loop that steadily raises the baseline. Teams start to see benchmarking less as an audit and more as a practical tool for improving processes and making the case for better support.
Actions to build into this phase:
- Document findings from each review cycle in a shared, accessible format
- Assign clear owners for each standardization action
- Set a fixed re-benchmarking schedule and protect it from being deprioritized under project pressure
- Track improvement trends over time, not just point-in-time snapshots
This is also the stage where project teams can connect benchmark results back to construction workflows, construction operations, and future project planning. The more structured the review, the easier it is to scale the workflow.
Frequently Asked Questions
What is a BIM benchmarking workflow?
A BIM benchmarking workflow is a structured way to measure how BIM performs across planning, design, construction, handover, and operations. It compares current performance against baselines, standards, past results, or external examples.
Why do BIM benchmarks matter before scaling BIM?
Benchmarks give leaders a clear starting point. Without a baseline, teams can invest in tools, training, and process changes without knowing whether BIM is improving coordination, reducing rework, or supporting cost and schedule control.
Which BIM KPIs should teams track?
Useful BIM KPIs include model completeness, accuracy, clash density, data consistency, review cycles, rework rate, RFI volume, approval time, cost variance, schedule variance, user participation, and standards compliance.
How does BIM benchmarking support digital twins?
BIM benchmarking improves digital twin readiness by setting clear thresholds for asset data quality, naming conventions, classifications, and performance baselines before handover. Clean benchmarked data makes operational tracking more reliable.
What are the common mistakes in BIM benchmarking?
Common pitfalls include tracking too many metrics, relying on poor-quality data, using inconsistent definitions, and failing to secure executive ownership. A focused scorecard and clear governance structure make benchmarking easier to sustain.
Common Pitfalls: Too Many Metrics, Poor Data Quality, and No Executive Ownership
Even well-designed BIM benchmarking programs can lose momentum. Three failure points show up again and again across organizations.
Tracking too many metrics at once is the most common mistake. When teams try to measure everything, reporting turns into a burden, the insights get diluted, and stakeholders tune out. A focused set of five to ten meaningful metrics will usually outperform a sprawling dashboard. Start narrow, prove the value, then expand.
Poor data quality can undermine the whole effort. If model data is inconsistent, issue logs are incomplete, or different teams use different definitions for the same metric, the benchmark ends up reflecting data hygiene issues instead of actual workflow performance. Early investment in data governance, including naming conventions, model requirements, and logging standards, pays off across the entire benchmarking process.
Lack of executive ownership is the issue that quietly stalls long-term progress. BIM benchmarking needs cross-team coordination, tool investment, and process change. Without visible leadership support, it is easy for it to slip behind other priorities. Executives do not need to run the program, but they do need to back it, ask for updates, and act on the findings.
Avoiding these pitfalls is not complicated, but it does take intent. The organizations that get real value from BIM benchmarking are the ones that treat it as an ongoing business practice, not a one-time exercise. They also keep an eye on performance, quality, scale, and the technologies that shape delivery.
Ready to Take the Next Step?
If you’re exploring modern cost estimation platforms, check out Nomitech’s full suite or get in touch with our team to find the right fit for your workflows.




Stay Up to Date
Subscribe to our Newsletter today and receive the latest updates, trends, expert insights, and exclusive offers tailored to your specific industry.