

What Is AI Cost Benchmarking for Enterprises?
TL;DR: AI cost benchmarking helps organizations compare AI spend, performance, and business value against internal baselines, market rates, and strategic targets.
Done well, it improves budgeting, vendor negotiations, governance, and model selection by showing where AI is delivering returns and where costs are drifting.
The goal is not just to track AI expenses, but to manage them with a clearer view of total cost, outcomes, and tradeoffs.
What AI Cost Benchmarking Means
AI costs tend to spread faster than most teams expect. What starts as a few model subscriptions or a promising pilot can turn into fragmented vendor bills, hidden integration work, and growing pressure from leadership to explain what the business is actually getting in return. When estimates vary from team to team and spend is scattered across departments, it gets hard to tell whether AI is being scaled intentionally or simply becoming more expensive.
That is why ai cost benchmarking has become so important. As budgets tighten, use cases multiply, and pricing shifts across models and infrastructure, organizations need a more disciplined way to compare spend against outcomes. AI cost benchmarking gives them that structure. It helps decision-makers see what they are paying for, how those costs stack up against internal targets or market references, and where tools like Nomitech can support more consistent cost analysis and scenario planning across the business.
Before getting into frameworks and tools, it helps to get clear on what this looks like in practice and why it matters right now.
Defining AI Cost Benchmarking for Enterprise Decision-Makers
At its simplest, AI cost benchmarking means measuring AI spend and performance against a defined set of benchmarks. Those benchmarks might be internal baselines, industry comparisons, or business metrics the company has already agreed to track. The aim is straightforward: give decision-makers a reliable view of whether AI investments are producing real value for the money being spent.
This goes well beyond tracking invoices or counting licenses. A useful benchmarking approach looks across multiple dimensions of performance. PwC, for example, uses a framework built around five pillars: Financial, Operating, Functional, Trust, and Workforce. Their model draws on more than 30 primary metrics and over 100 secondary metrics to build a fuller picture of AI impact.
In practice, that might mean looking at AI investment as a share of revenue on the financial side. On the operational side, it could mean measuring the percentage of customer interactions handled by AI to see how deeply it is embedded in day-to-day work. It can also mean using standardized metrics to judge whether a project’s actual costs are reasonable for the output provided, which is what makes a benchmark useful for decision making rather than just reporting.
For enterprise leaders, that kind of structure changes the conversation. AI evaluation becomes less subjective and much easier to defend. It supports better vendor choices, clearer accountability across teams, and stronger forecasting. In environments where cost control matters, tools like Nomitech can also support the broader discipline by helping teams create more consistent cost views and compare investment scenarios with less guesswork.
Why the Topic Is Rising as AI Spending Accelerates
The reason this topic is getting more attention is pretty simple: AI spending is moving fast. AI infrastructure investment is expected to reach $375 billion in 2025, representing a 67% increase from 2024 levels, according to Prodia. At the company level, average monthly AI spending is projected to rise from $62,964 in 2024 to about $85,521 in 2025, roughly a 36% year-over-year increase.
When budgets grow that quickly, mistakes get expensive. Without a consistent benchmarking process, organizations can end up overpaying for tools that underdeliver, buying overlapping capabilities across departments, or funding AI initiatives that create more noise than results.
Market concentration adds another layer of pressure. The U.S. alone is expected to account for roughly $159 billion, or 79% of total global AI funding in 2025. In that environment, companies that benchmark well have a clear edge. They can see where AI is creating measurable returns and where it is simply adding cost.
Core Questions Benchmarking Should Answer
A strong AI cost benchmarking program is not just another reporting layer. It is a decision tool. The best frameworks help leaders make better calls on budgets, vendors, deployment priorities, and long-term ai strategy.
Some of the most important questions a benchmarking framework should answer include:
- What are we spending on AI, and how does that compare to revenue or operational scale? Metrics like AI investment as a percentage of revenue, as used in PwC's benchmarking framework, put spending in context and make it easier to judge whether it is reasonable.
- Where is AI actually being used? Operational metrics such as the share of customer interactions handled by AI show whether adoption is broad and built into workflows or still limited and experimental.
- Are we getting value across all dimensions, not just financial ones? AI affects workforce capacity, trust, and functional performance, not just budgets. A multi-pillar view gives a much more accurate read than any single metric.
- How are our spending trends tracking against the market? With average organizational AI budgets rising sharply year over year, as noted by Prodia, leaders need real reference points to tell whether their own spending path is measured or excessive.
- Which vendors and models deliver the best performance per dollar? Benchmarking creates a more honest basis for comparison, so procurement decisions rely less on vendor claims and more on measurable outcomes. This is especially useful when teams need to compare options across business units or align cost assumptions in a more disciplined estimating workflow.
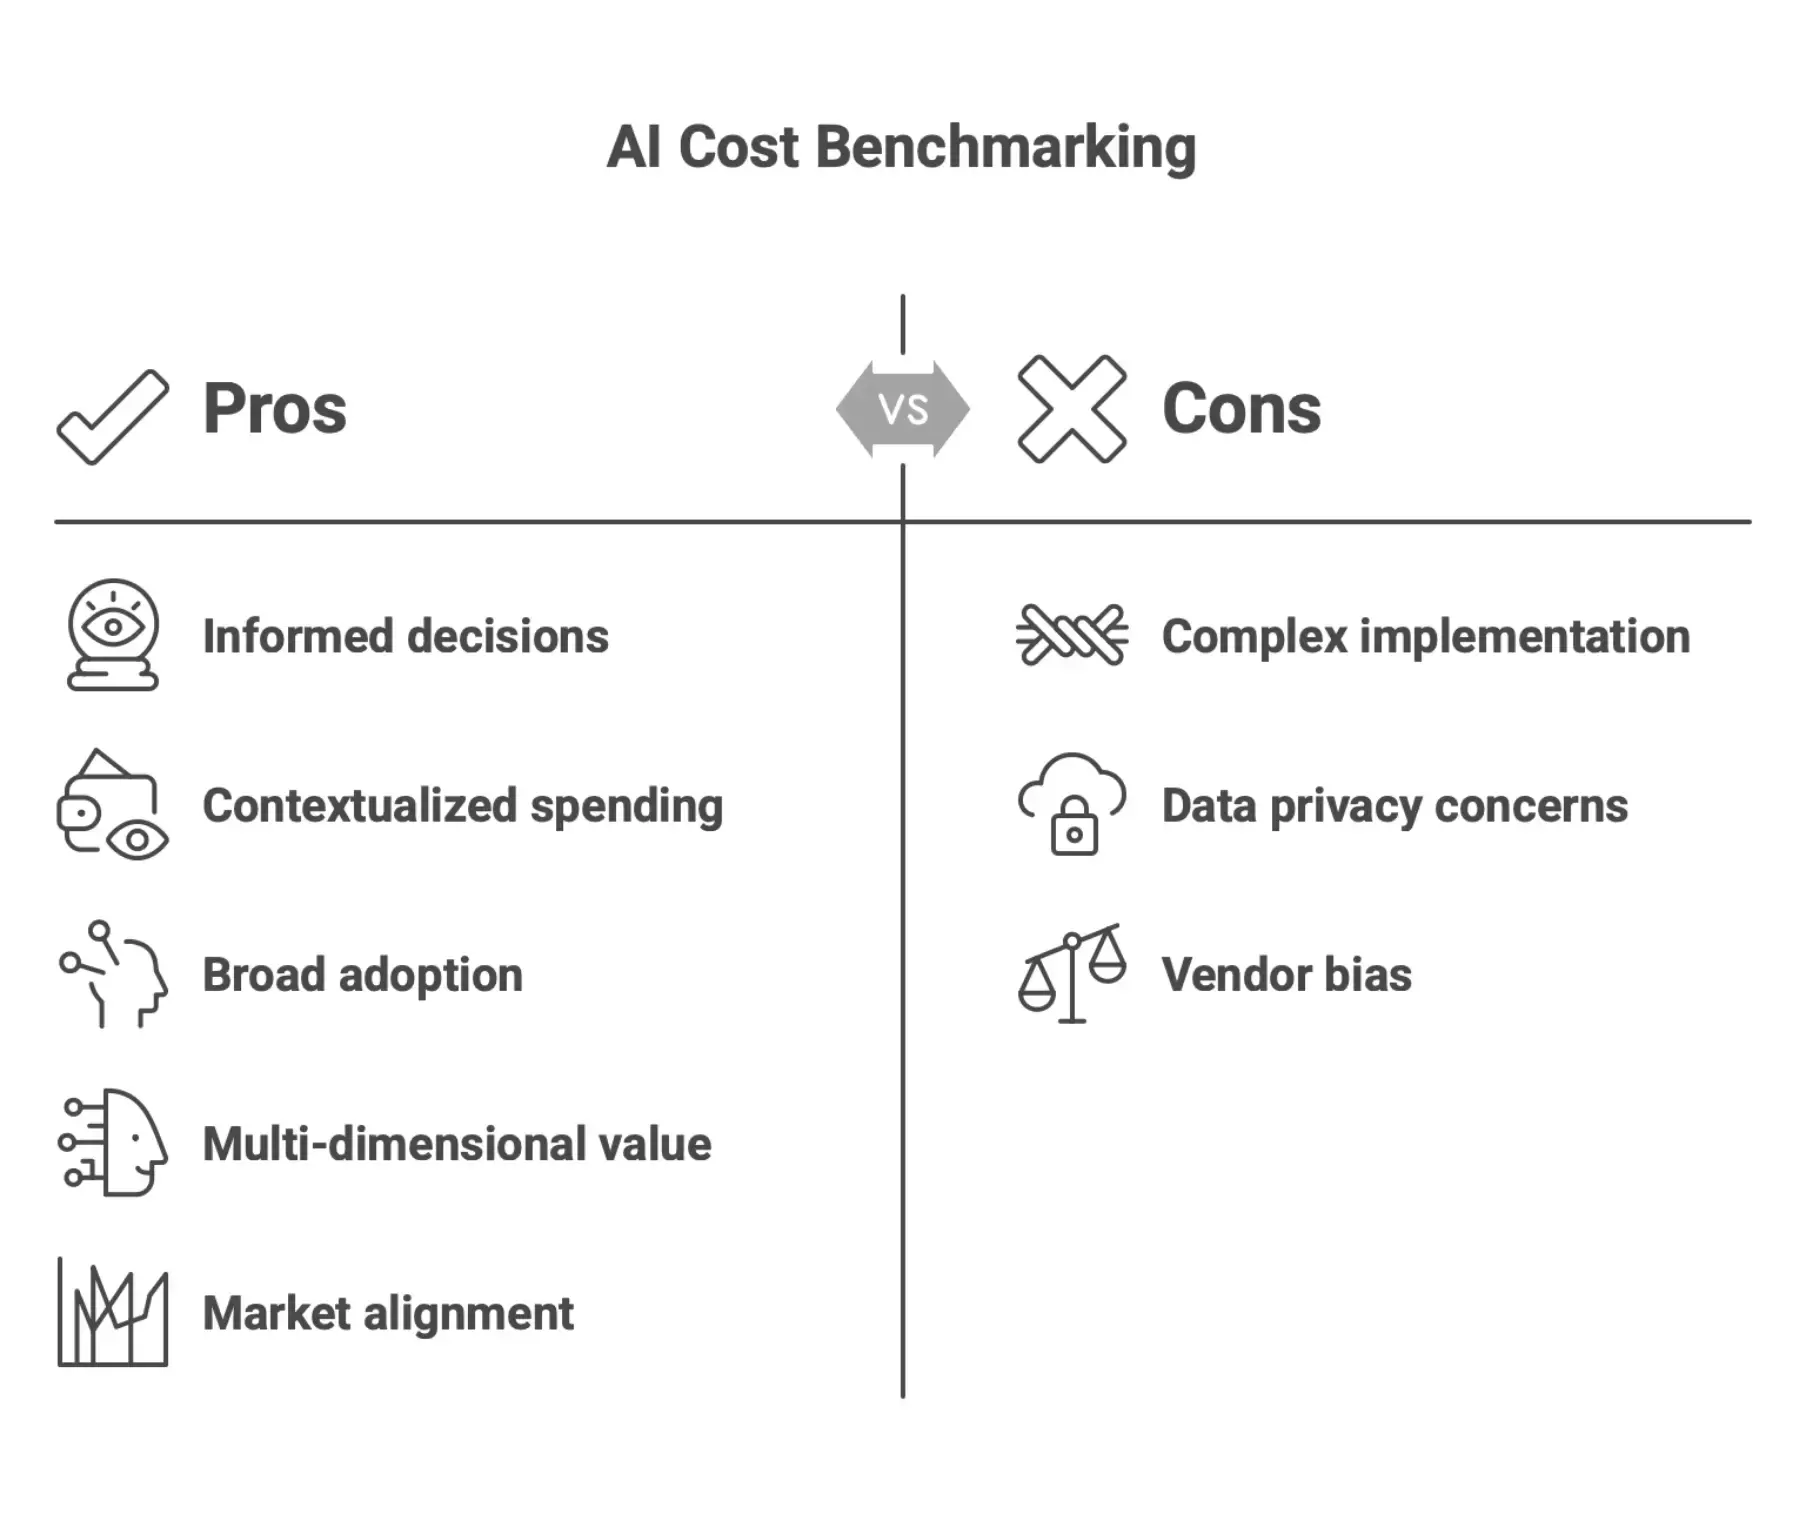
These are the questions that make AI cost benchmarking useful in the real world. Without them, even well-funded AI programs can end up running on assumptions instead of evidence.
Why AI Cost Benchmarking Matters to the Business
As AI spending grows across the enterprise, the gap is widening between companies that manage those investments deliberately and those that simply react to rising costs. AI cost benchmarking gives teams a practical way to see what they are spending, what value they are getting back, and where adjustments are needed. For finance leaders, procurement teams, and technology executives, that level of visibility is no longer a nice extra. It is part of responsible AI governance.
Finding Cost Savings in Outsourced and Managed Services
One of the clearest business benefits of AI cost benchmarking is its ability to surface cost savings in third-party contracts. When organizations compare managed services against current market pricing and actual provider capabilities, the savings can be substantial.
According to InformationWeek, AI benchmarking can reveal savings of 15 to 30 percent in IT services contracts. Much of that comes from spotting AIOps efficiencies providers may already be benefiting from, without those gains being reflected in customer pricing. The numbers by service area show how far the market has shifted:
- Service desk pricing has dropped by as much as 50%
- Network, workplace, application management, and security services have seen reductions in the range of 25 to 30%
- Data center services reflect pricing declines of around 15%
- BPO contracts have achieved savings closer to 40%

These are not theoretical savings. They reflect real pricing changes that benchmarking brings into view. Without a reliable baseline, many organizations keep paying yesterday’s rates for services the market has already repriced. Organizations with benchmarking clauses in place may be in the best position to capture those savings because they have a documented mechanism to challenge outdated pricing models during renewals.
For procurement and vendor management teams, that makes benchmarking a direct path to cost recovery, not just a reporting exercise. In practice, this is where structured cost benchmarking tools can support better negotiations by giving teams a clearer market reference before renewal discussions begin.
Improving Budget Planning and Investment Governance
Benchmarking does more than expose overpayment. It gives organizations a consistent way to assess whether AI investments are producing measurable business value, which is exactly what finance and executive teams need when AI spend starts to scale.
PwC's AI benchmarking framework is a good example. It evaluates AI investment performance across five pillars: Financial, Operating, Functional, Trust, and Workforce. The model uses more than 30 primary metrics and over 100 secondary metrics to create a broad view of AI impact. For instance, tracking AI investment as a share of revenue gives finance teams a solid reference point for budget planning, while measuring the percentage of customer interactions handled by AI ties operational performance back to investment outcomes.
That kind of structure changes the discussion. AI stops looking like a vague cost center and starts being managed more like an investment portfolio with clear performance markers. When leaders can point to agreed metrics and credible data, budget reviews become less about defending spend and more about improving it. Planning gets tighter, approvals get easier, and investment decisions rely less on assumptions.
It also supports better budget allocation. Instead of spreading money evenly across every request, leaders can direct funding toward the ai initiatives that show the strongest link to strategic objectives, operational efficiency, or revenue impact. For teams already using cost engineering or estimating systems such as those from Nomitech, benchmarking can fit naturally into existing governance workflows by adding a stronger external reference point alongside internal cost and performance data.
Preventing Overspend as AI Adoption Scales
The urgency here is real. AI spending is not sitting still. It is climbing across infrastructure, software, services, and internal delivery teams. Without benchmarking, those costs can build quietly in the background until they become a much bigger issue.
Prodia reports that global AI infrastructure investment is projected to reach $375 billion in 2025, up 67 percent from 2024. At the company level, average monthly AI spending is expected to rise from $62,964 in 2024 to about $85,521 in 2025, a 36 percent year-over-year increase.
For any organization rolling out AI across multiple teams, platforms, or use cases, that kind of growth needs oversight. Benchmarking provides it. It helps establish what normal spending looks like by category, highlights outliers early, and gives leadership a more consistent way to judge whether higher costs are actually delivering higher value.
Organizations that build benchmarking into AI governance early are in a much stronger position to scale with confidence. The ones that wait usually end up in a familiar cycle: renegotiating contracts after the fact, explaining unexpected costs, or trying to justify AI spending to boards and stakeholders who want clear, defensible numbers.
What AI Costs Should Be Benchmarked
Strong AI cost benchmarking starts with a basic question: what are you actually measuring?
A lot of teams look at license fees or API rates first. That makes sense, but it is also where budgets start to drift. Six months later, the real cost shows up in integration work, data prep, infrastructure, and support effort that never made it into the original comparison.
To benchmark AI costs properly, you need to look at the full stack. That includes what it takes to build the solution, what it costs to operate, and the work in between that rarely appears on a vendor pricing page. In practice, this is the same discipline many estimators and EPC teams already apply to project costing. You need the complete picture, not just the headline number. For most organizations, that means moving beyond simple vendor quotes and building a full total cost of ownership view that includes infrastructure, data acquisition or labeling, software licenses, personnel, security, and ongoing maintenance.
Benchmarking AI Implementation Costs by AI Use Case
AI projects do not cost the same, and they should not be benchmarked as if they do. A customer service chatbot has a very different delivery profile from a fine-tuned language model or a custom AI product built for a specific business process.
According to AIStackHub, implementation costs can vary widely based on scope:
- AI chatbot for customer service: $15,000 to $80,000
- RAG-based document Q&A system: $25,000 to $150,000
- Fine-tuning a custom LLM: $50,000 to $500,000 or more
- Building an AI-native product from scratch: $200,000 to $2,000,000 or more
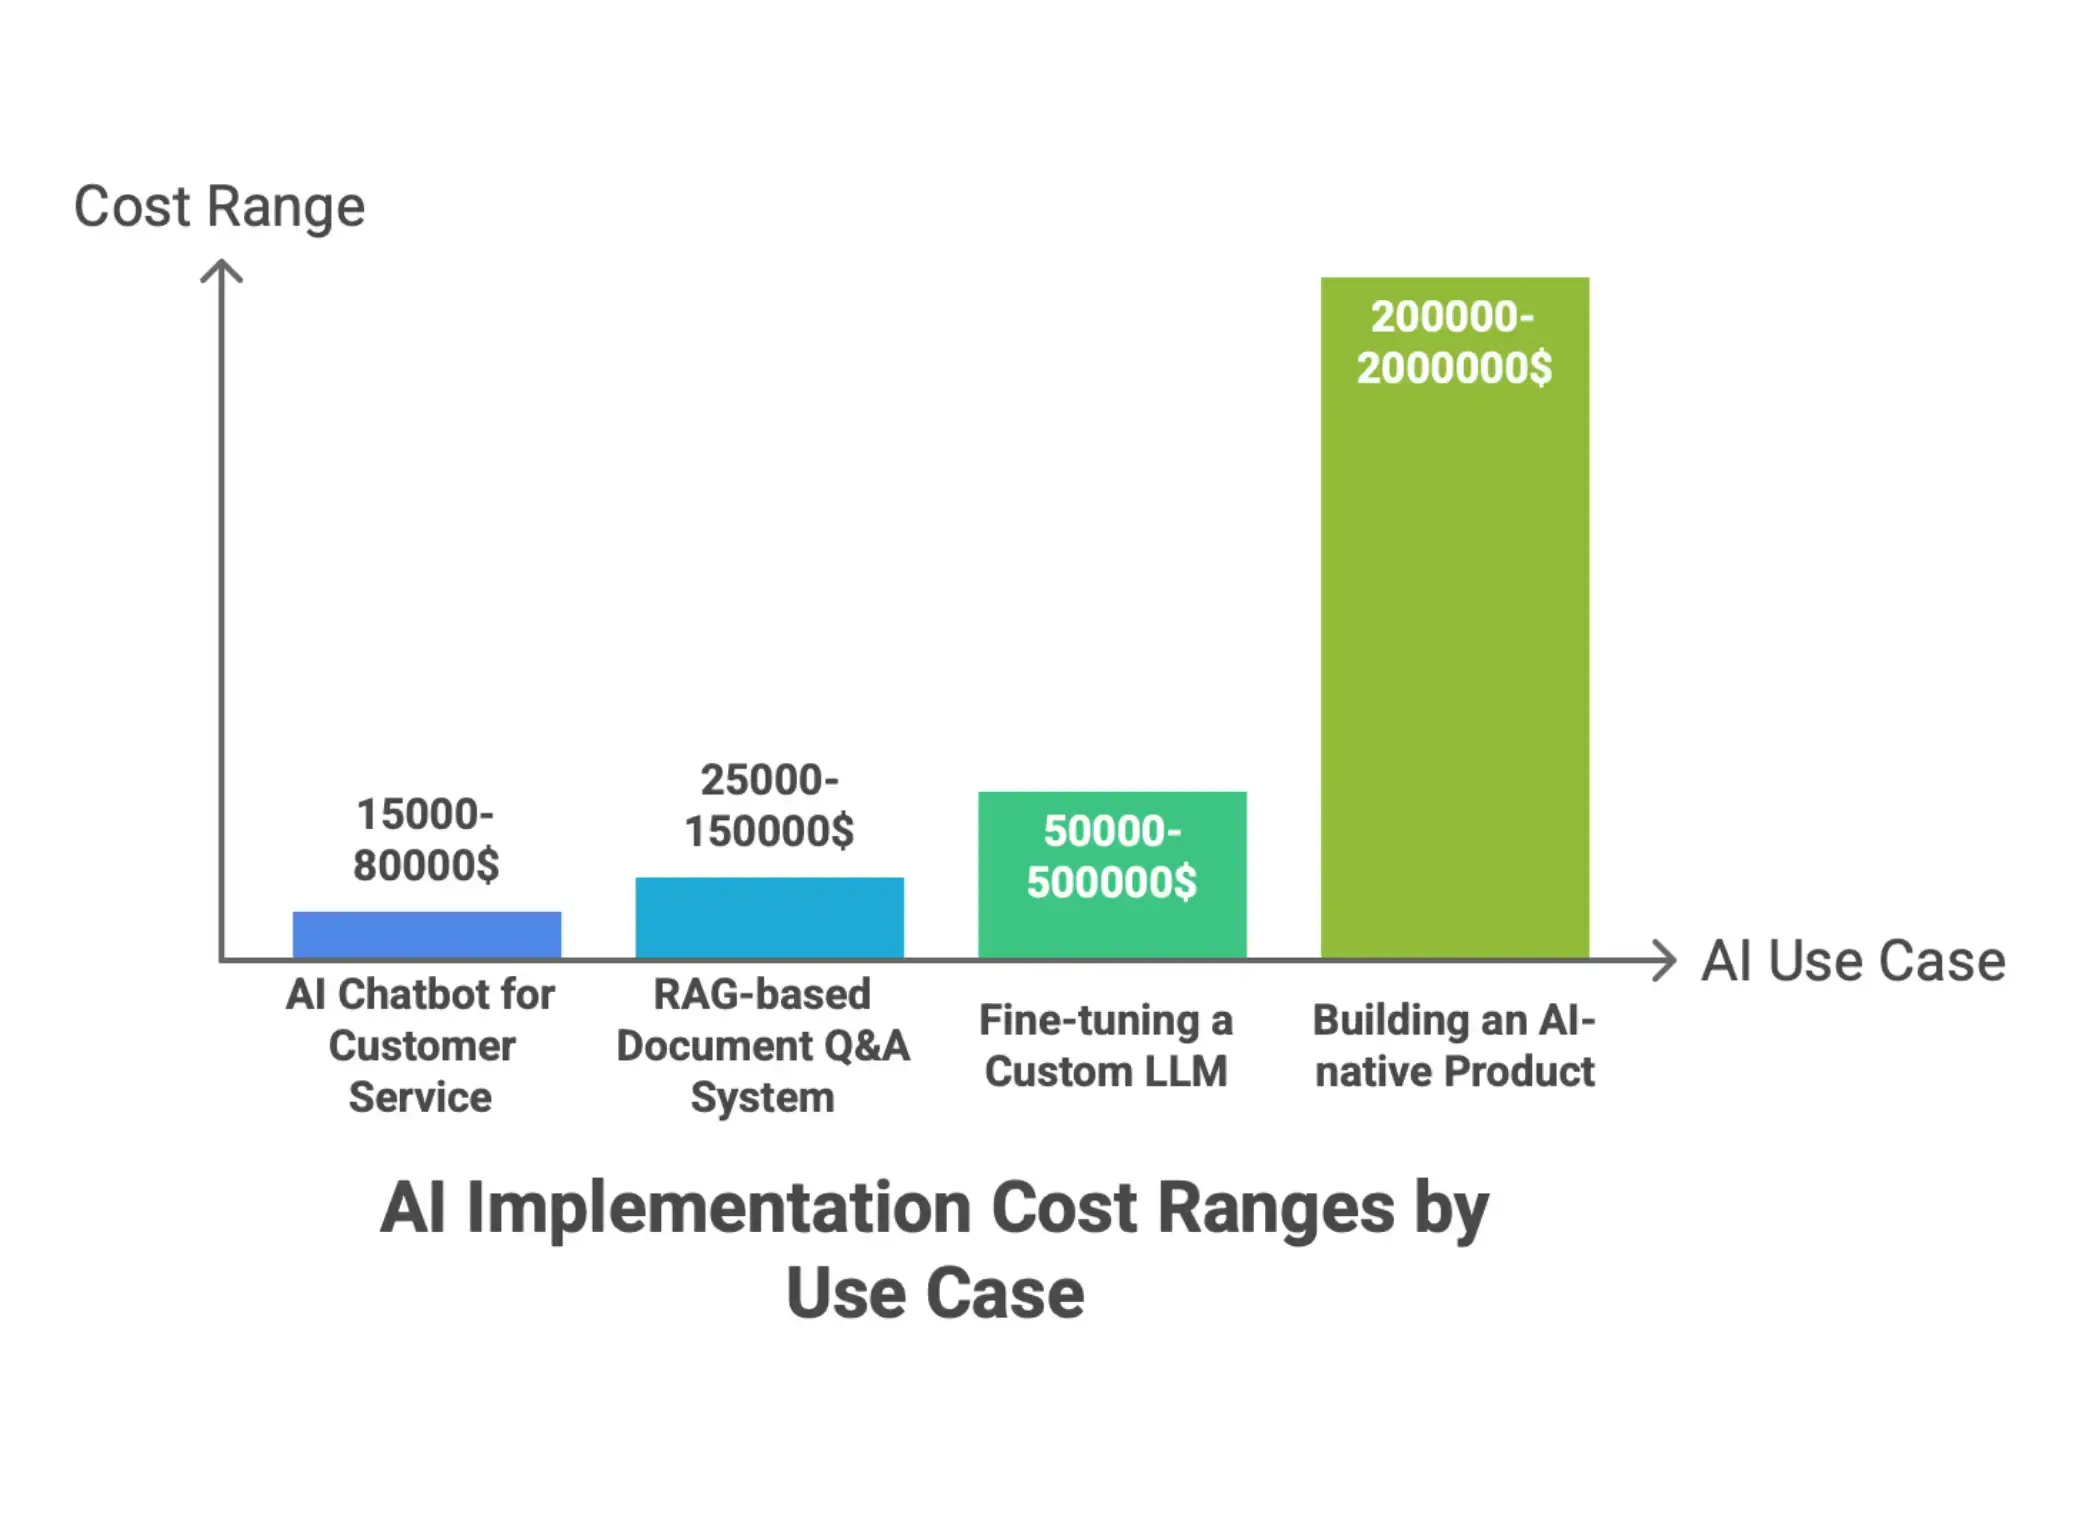
Those ranges are wide for a reason. Complexity changes. Data quality changes. Integration depth changes. A lightweight internal assistant is not in the same category as a production-grade AI tool tied into enterprise systems.
So when you benchmark, compare like with like. Putting the cost of a basic chatbot next to the cost of a custom LLM project does not tell you much unless the use cases are genuinely similar in scope, risk, and expected output.
A practical place to start is grouping AI initiatives by type, then benchmarking each one against projects with similar objectives and delivery requirements. That makes the comparison more useful and a lot more honest. Running small pilots with real production data is often the best way to estimate a specific use case before wider rollout. It gives teams a clearer read on actual costs, likely complexity, and the operational overhead needed to make the solution work in practice.
Accounting for Hidden Costs Beyond Model or Software Pricing
Model pricing and subscription fees are only the visible layer. The costs that usually cause problems are the ones tied to implementation, cleanup, and scaling.
USM Systems highlights three major hidden cost areas outside the base software price:
- Data preparation: Typically 15 to 20% of total project cost, usually incurred in the first three months, ranging from $10,000 to $90,000
- Integration work: Often 20 to 30% of total cost, occurring between months two and five, with costs running from $20,000 to $100,000
- Infrastructure scaling: Around 15 to 25% of total cost, typically surfacing between months three and six, and adding $15,000 to $75,000
These are not minor add-ons. Th
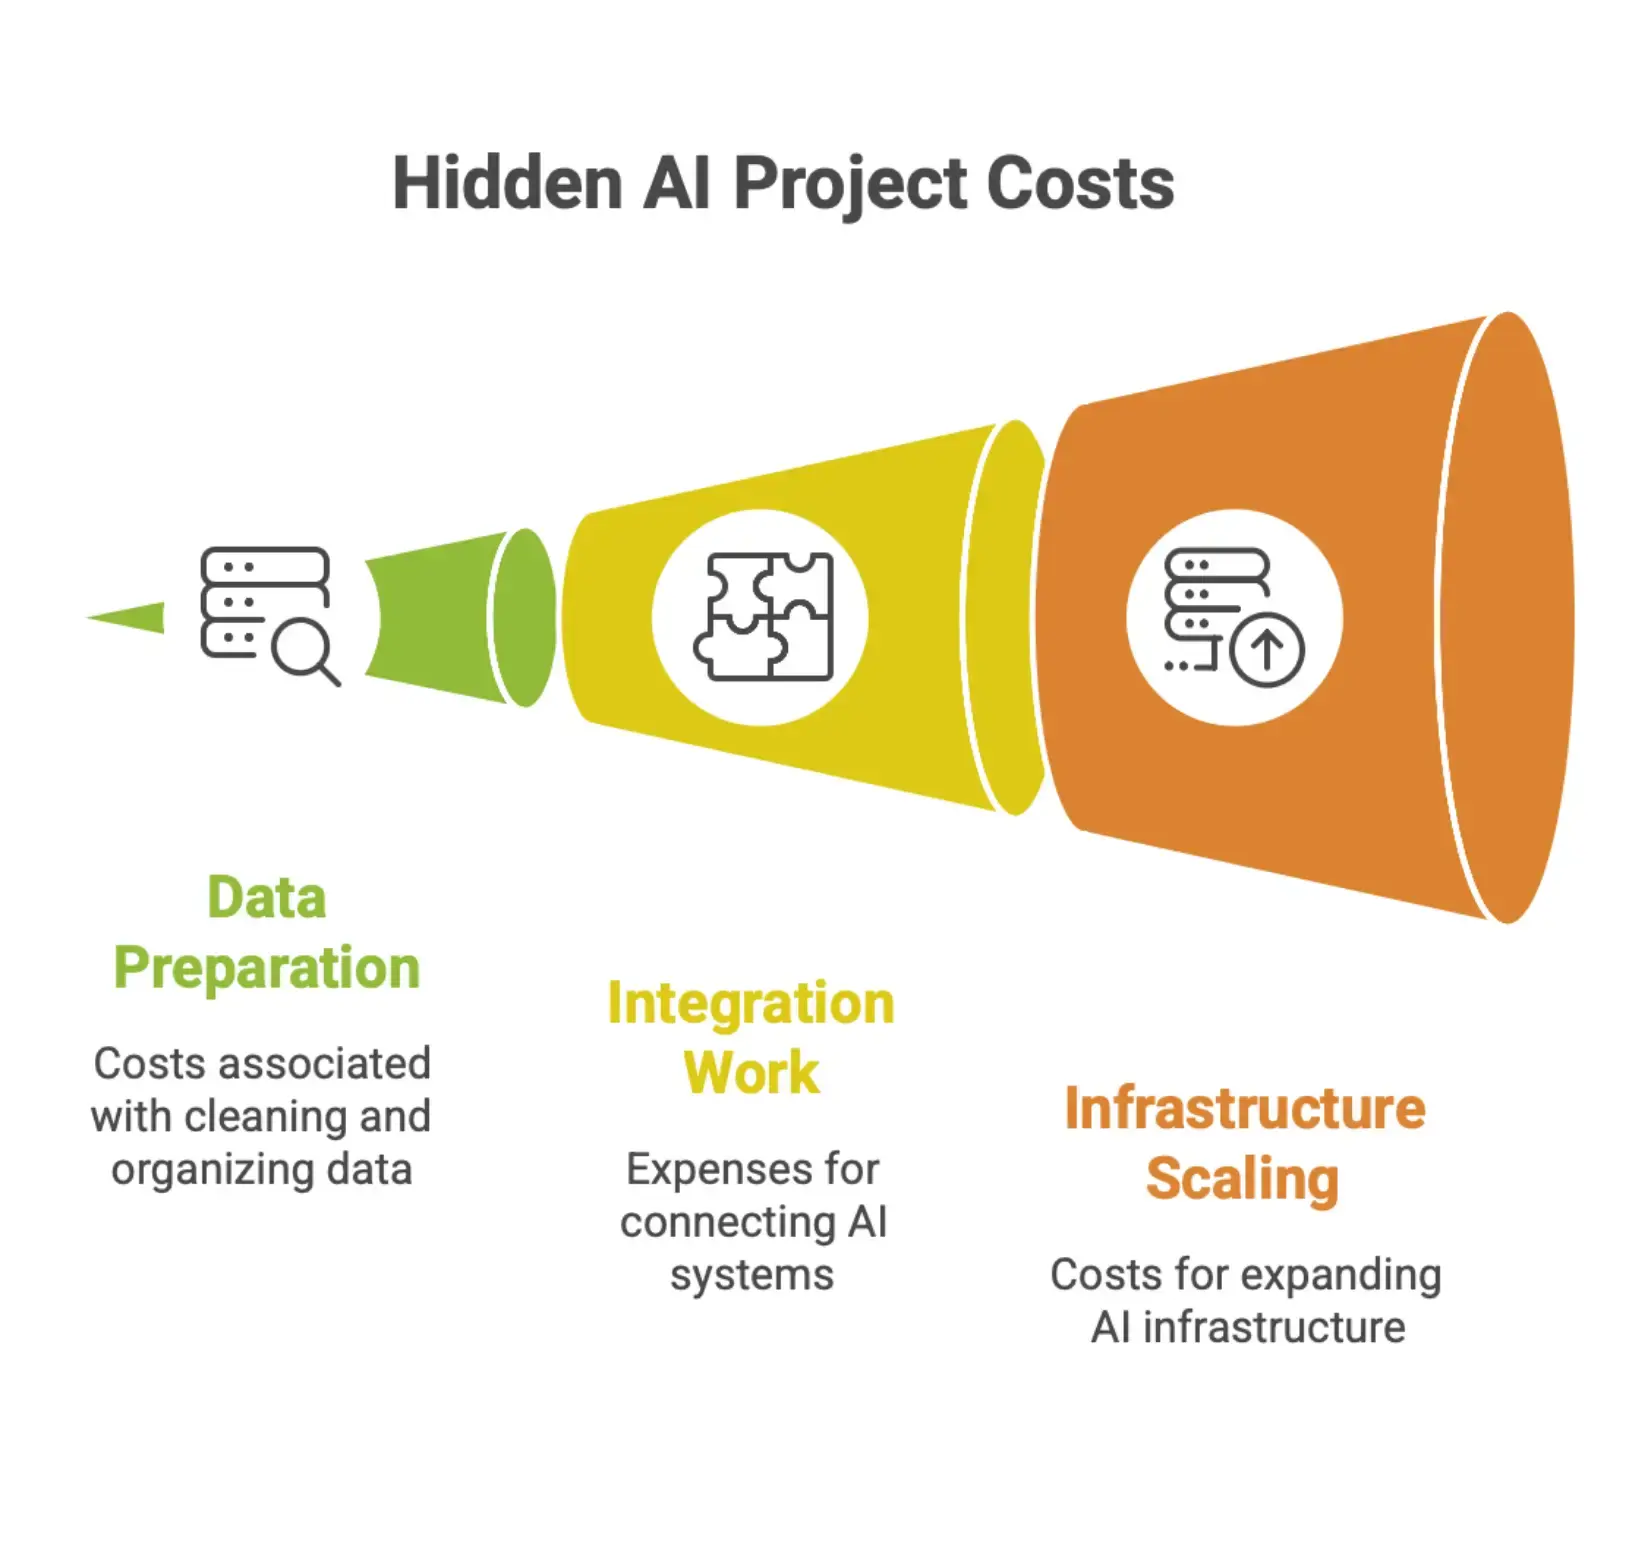
ey represent real engineering hours, system design, validation work, and operational effort. And they are easy to underestimate early on.
If you are benchmarking AI solutions, these costs need to be part of the comparison across vendors, delivery models, and implementation strategies. They should not be treated as side expenses to figure out later. Hidden costs for AI projects can also include compliance audits, security hardening, regulatory compliance checks, and integration maintenance, all of which may add another 20 to 30 percent to overall expenses. In some environments, the gap between a vendor’s initial quote and the full ownership picture can grow by 200 to 400 percent once all secondary expenses are included.
A benchmark that stops at platform fees or token pricing is incomplete. If it ignores data prep and integration effort, it will almost always understate the true cost. Many teams also underestimate how much money is tied up in data work alone. In some AI applications, data preparation and labeling can consume a very large share of the budget, especially when vast amounts of operational data need to be cleaned, tagged, or governed before models can be deployed safely.
Separating One-Time Build Costs from Recurring Run Costs
One of the most useful moves in AI cost benchmarking is separating one-time build costs from recurring run costs.
They behave differently. They scale differently. And they shape investment decisions in different ways.
Build costs are the upfront pieces: design, development, data setup, integration, testing, and rollout. Run costs continue after go-live. These include API usage, compute, storage, monitoring, support, and model updates. AIStackHub notes that ongoing API and compute costs typically add 20 to 40% of the original build cost annually. So a $100,000 implementation may carry another $20,000 to $40,000 each year after launch.
For many AI solutions, annual ongoing maintenance should also be budgeted explicitly. A practical benchmark is around 15 to 25 percent of the initial build cost each year, though some projects land closer to 20 to 35 percent once retraining, monitoring, support, and compliance work are included. That is especially important for generative ai systems and other AI systems that require frequent updates, changing prompts, new guardrails, or periodic model training to stay useful and reliable.
For benchmarking, this split helps you:
- Compare vendor options on both upfront cost and long-term operating cost
- Spot where expenses rise as usage grows
- Build more realistic total cost of ownership forecasts over a 2 to 3 year period
When reviewing AI solutions, ask for both numbers: the build estimate and the expected annual run cost. Some tools look inexpensive at the start but become costly once usage ramps up. Others require more upfront effort but are easier to sustain over time.
That fuller view matters. Whether you are evaluating a general AI stack or a more specialized workflow tool such as those used in cost engineering environments, the benchmark is only useful when both the initial investment and the ongoing cost are visible.
How to Benchmark AI Costs Across AI Models and Infrastructure
Benchmarking AI costs is not about chasing a single number. You need to look at model pricing, infrastructure spend, and performance tradeoffs together. These pieces affect each other, and they move fast. The goal is to understand what you are really paying for and whether the return justifies it.
Comparing AI Models on Price, Speed, Latency, and Quality
Choosing a model on price alone is one of the most common early mistakes. A cheaper model might look good in a spreadsheet, but if it responds slowly or produces weaker results, the real cost shows up elsewhere. Teams end up spending more time on rework, waiting on outputs, or dealing with lower task accuracy.
A better benchmark looks at several factors at once. According to Artificial Analysis, side-by-side comparisons across quality, price, output speed, latency, and context window give a much clearer view of real-world value. Models such as Qwen3.5 0.8B and Gemma 3n E4B are priced at $0.02 per million tokens, which puts them among the lowest-cost options available today. Qwen3.5 2B is close behind.
That kind of comparison matters in real delivery environments. A model that works well for high-volume document processing may still be the wrong fit for a user-facing workflow where response time matters more than token cost. The best benchmarking setups reflect the workload itself. They show tradeoffs by use case instead of treating every task as if it has the same requirements. Effective comparisons should mirror actual tasks and real ai workloads, not generic prompts, because that is the only way to see how a model behaves under production conditions.
Key dimensions worth tracking in any model comparison include:
- Price per million tokens for input and output where relevant
- Output speed measured in tokens per second under load
- Time to first token as a direct signal of latency
- Quality scores based on the benchmarks that matter to your use case
- Context window size which determines how much information the model can handle in one request
For large language models, one useful comparison unit is the average cost per token after aggregating all relevant expenses. That means not just API pricing, but retries, longer outputs, retrieval calls, monitoring, and support activity. When teams benchmark that full unit cost across ai models, they usually get a much more honest view of what is significantly cheaper and what only looks cheaper at first glance.
Tracking the Rapid Decline in Inference and Hardware Costs
One of the biggest challenges in AI cost benchmarking is how quickly costs are dropping. A benchmark that felt current 18 months ago can already be outdated.
The shift is significant. As documented in the Stanford HAI 2025 AI Index Report, inference cost for a system performing at GPT-3.5 level fell by more than 280 times between November 2022 and October 2024. That is not a minor efficiency gain. It is a full repricing of inference economics.
The same pattern shows up on the hardware side. The report notes that hardware costs have been declining by roughly 30% per year, while energy efficiency has improved by around 40% annually. Those gains add up quickly. In practice, the cost to run AI workloads is falling faster than many organizations are updating budgets, contracts, or internal assumptions.
That creates a real risk. If your team is still working from older pricing models or long-term infrastructure commitments, you may be paying well above current market rates. Regular benchmarking helps close that gap. Quarterly reviews are a sensible baseline. They give teams a chance to reset cost assumptions and decide whether it is time to renegotiate, replatform, or shift workloads.
Benchmarking AI Systems and Infrastructure Spend Against Market Direction
Model pricing is only one part of the total cost picture. Infrastructure often accounts for a large and growing share of AI spend, especially once workloads move into production. That includes compute, storage, networking, and the environments used to deploy and manage models. To benchmark well, you need to compare your internal costs against where the market is heading, not just against last quarter’s budget.
The market signals are hard to ignore. According to the Prodia Blog, global AI infrastructure investment is projected to reach $375 billion in 2025, up 67% from 2024. At the company level, average monthly AI spending is expected to rise from $62,964 in 2024 to about $85,521 in 2025, which is a 36% year-over-year increase.
Those figures are useful as an external benchmark. If your organization’s infrastructure spend is climbing much faster than 36% without a matching increase in usage, throughput, or capability, it is worth looking closer. On the other hand, if spend has barely moved while the rest of the market is scaling quickly, that may point to underinvestment that limits performance or slows adoption.
A few principles make infrastructure benchmarking more useful in practice:
- Compare your cost-per-workload trend, not just total spend, so you can separate usage growth from inefficiency
- Revisit build versus buy decisions against current cloud and managed inference pricing, especially as prices continue to fall
- Factor in geography since the U.S. is expected to account for roughly 79% of total AI funding in 2025, and local pricing conditions may differ from global averages
- Set regular internal benchmark reviews so your baselines reflect current market conditions rather than old assumptions
This is also where FinOps methods become useful. Organizations that self-host models or run AI as general workloads on cloud platforms can often leverage forecasting, shared cost showback, and planning disciplines already used for broader infrastructure spend. For finance teams, accurate cost forecasting for ai workloads is critical because usage spikes, storage growth, and traffic shifts can make cloud bills hard to predict.
Teams that treat cost benchmarking as an ongoing discipline tend to make better infrastructure decisions over time. That is true whether they manage AI cost analysis in internal dashboards or through broader estimating and planning workflows such as those supported by Nomitech. The key is consistency. Review often, compare against the market, and adjust before inefficiencies become locked in.
Key Metrics and Frameworks to Use
It is one thing to know AI spending is climbing. It is another to know whether that spend is actually paying off. For leaders making budget and strategy decisions, that comes down to having the right measurement framework in place before money is committed, not after.
With that in mind, this section looks at how to benchmark AI costs in a structured way that stays tied to business outcomes.
Using a Multi-Pillar AI Cost Benchmarking Framework
A common mistake is judging AI performance through a single lens, usually financial return. That seems reasonable at first, but it misses a large part of the picture. AI affects operations, team performance, governance, and service delivery in ways a simple profit-and-loss view will not capture.
PwC addresses this with a benchmarking framework built around five pillars: Financial, Operating, Functional, Trust, and Workforce. Those pillars are backed by more than 30 primary metrics and over 100 secondary metrics, giving organizations a practical structure for evaluating AI impact across the business.
The real value of a framework like this is that it pushes leaders to ask better questions. Not just "what did we spend?" or "what did we get back?" but also:
- How is AI changing the way teams work?
- Are governance and trust controls keeping pace with deployment?
- Where are we seeing measurable improvement at the process or functional level?
For any organization taking AI cost benchmarking seriously, this kind of broad, balanced framework is a strong place to start. It also helps avoid the trap of optimizing around one metric while missing the bigger picture on business value, risk, or operational efficiency.
Financial and Operating Metrics That Matter Most
Once the framework is in place, the next step is choosing metrics that actually tell you something useful.
On the financial side, PwC highlights AI investment as a percentage of revenue as a strong primary metric. It gives leadership a clear view of how AI spending scales with the size of the business and makes it easier to compare spending over time or against industry peers.
On the operating side, the percentage of customer interactions handled by AI is another useful example from the same framework. Metrics like this connect AI directly to workflow impact and service delivery. They show whether AI is carrying real workload or simply sitting in the background without much effect.
That split between financial and operating metrics matters. Financial metrics show investment level and return. Operating metrics show how deeply AI is actually embedded in day-to-day work. You need both if you want a view that reflects reality.
As you build your own internal benchmarking model, focus on metrics that support real decisions. If a metric looks good on a dashboard but never affects staffing, prioritization, or spend, it is probably noise. Teams using structured cost tools like those from Nomitech often spot this quickly. The most useful metrics are the ones that hold up during planning reviews, not just reporting cycles. In sectors like manufacturing, logistics, or utilities, example operating metrics may include predictive maintenance performance, workflow automation throughput, or whether AI applications are reducing manual review time without harming quality.
Balancing AI Cost Efficiency with Trust, Workforce, and Functional Impact
Cost efficiency matters. Of course it does. But organizations that optimize for cost alone often run into problems later, from employee pushback to weak governance to uneven results across teams.
That is why the PwC framework includes Trust and Workforce alongside Financial and Operating measures. AI does not just affect the balance sheet. It changes how work gets done, how decisions are made, and how much confidence people have in the outputs.
The Functional pillar adds another layer by measuring AI performance at the task and process level within specific business functions. That gives leaders a more grounded view of where AI is working, where it is not, and where corrective action may be needed. Trust metrics should also cover issues like regulatory compliance, auditability, and whether automated pipelines are tracking model versions and benchmark results for future review.
The practical takeaway is simple: if your benchmarking framework only tracks cost and return, you are missing part of the story. To turn benchmarking into a real management tool, you need measures for workforce impact, trust, and functional performance alongside the financials.
AI Cost Optimization Strategies Informed by Benchmarking
Benchmarking only matters if it changes what you do next. With AI spend, that usually means making smarter calls about model selection, routing, and vendor pricing. Once you can see how models compare on cost and performance, you have something useful to work with. Teams can tighten spend, protect quality, and negotiate from a much stronger position. Here is what that looks like in practice.
Using Model Routing to Reduce Enterprise AI Spend
Not every AI task needs a top-tier model. Classifying a support ticket is one thing. Summarizing a dense legal file is another. But in many organizations, both still get sent to the same expensive model by default.
That is where enterprise AI gateways come in. They add cost-aware routing so each request goes to the right model for the job. According to Maxim AI, this can reduce overall AI spend by 30 to 50 percent. The logic is simple. High-volume, lower-complexity work goes to budget models that cost around $0.10 per million tokens. More demanding reasoning tasks are sent to frontier models that may cost $15 or more per million tokens.
At enterprise scale, that difference adds up quickly. A small pricing gap per token does not look dramatic on paper. Across millions of routine requests, it becomes a serious budget issue. Benchmarking gives teams the evidence they need to route more aggressively without taking unnecessary risks on output quality. In practice, that means fewer blanket defaults and more deliberate model use, which is exactly where cost control starts.
The industry is also moving toward hybrid architectures, where smaller local models handle routine requests and escalate only the harder prompts to larger, more expensive models. That pattern is becoming more relevant as agentic ai workflows expand. In agentic ai environments, one user request can trigger multiple tool calls, retrieval steps, and follow-up actions, so routing discipline matters even more for budget control.
Matching Task Complexity to the Lowest-Cost Viable Model
Routing only works when you know which models can handle which tasks reliably. That is why benchmarking matters. Tools like Artificial Analysis compare models across the metrics that actually influence production decisions, including quality, price, speed, latency, and context window size.
At the low end of the pricing range, models such as Qwen3.5 0.8B and Gemma 3n E4B come in at about $0.02 per million tokens, with Qwen3.5 2B in a similar range. For tasks like classification, summarization, or structured extraction, that may be more than enough. You do not always need the biggest model. You need the cheapest one that consistently clears the bar.
A practical workflow usually looks like this:
- Define the quality threshold the use case actually needs
- Benchmark candidate models using real tasks and real outputs
- Find the lowest-cost option that meets that threshold consistently
- Route production traffic to that model, with a fallback for exceptions
This is where benchmarking becomes operational, not just analytical. It stops being a one-time comparison exercise and turns into an ongoing control point for cost and performance. For teams managing AI portfolios across departments, that structure can make spend much easier to justify and govern. It is also the kind of evaluation process many organizations already apply in cost engineering tools, where disciplined comparison matters more than assumptions.
For some generative ai deployments, a lighter open model with accessible model weights may be enough for internal summarization or search augmentation. In other cases, the higher-quality option is still the right choice. The point of benchmarking is not to force every team to use the cheapest model. It is to determine whether the more expensive option is genuinely necessary for the specific use case.
Re-Benchmarking Vendors, Pricing Models, and Contracts as Market Prices Fall
AI pricing moves quickly. If your contracts, budgets, or internal cost assumptions were set 12 to 18 months ago, there is a good chance they no longer reflect the market.
The pace of price compression has been hard to ignore. The Stanford HAI 2025 AI Index Report found that inference costs for a system performing at GPT-3.5 level fell by more than 280 times between November 2022 and October 2024. On the hardware side, costs have been dropping by roughly 30 percent per year, while energy efficiency has improved by around 40 percent annually. Some vendors pass those gains through. Some do not unless customers push for it.
This does not stop at model APIs. It shows up across broader IT and service contracts too. InformationWeek reports that AI-driven benchmarking has helped organizations find 15 to 30 percent savings in IT services agreements. In some cases, service desk pricing has fallen by as much as 50 percent. Network, workplace, application management, and security services have seen reductions in the 25 to 30 percent range. BPO contracts have delivered savings closer to 40 percent, while data center pricing has dropped by about 15 percent.
The takeaway is straightforward. Re-benchmarking should be planned, not delayed until renewal season. A regular review cycle gives procurement and delivery teams current market data they can actually use in negotiations. It also helps prevent legacy pricing from quietly staying in place long after the market has moved on. It is also important to watch for pricing risks in newer vendor contracts, especially where response length drift, retry rates, retrieval bloat, and complex pricing models can make monthly bills less predictable than they first appear.
Common Benchmarking Challenges and Hidden Risks
AI cost benchmarking sounds simple enough: compare spend, compare results, pick the better option. In practice, it gets messy quickly. Most benchmarking mistakes are not caused by bad calculations. They come from partial data, old assumptions, and side-by-side comparisons that seem fair but are not actually measuring the same thing.
This is where teams usually get tripped up.
Missing Integration, Data Prep, and Hidden Costs
One of the most common mistakes in AI cost benchmarking is assuming the subscription or license fee tells the whole story. It does not. In many cases, that is only the starting point.
According to USM Systems, the hidden costs of deploying AI software usually fall into three major areas that sit outside the base subscription fee:
- Data preparation typically accounts for 15% to 20% of total project cost, ranging from $10,000 to $90,000. This usually hits hardest in the first one to three months of deployment.
- Integration work can make up 20% to 30% of total costs, often landing between $20,000 and $100,000, and tends to show up between months two and five.
- Infrastructure scaling adds another 15% to 25%, with costs ranging from $15,000 to $75,000. These costs often emerge between months three and six as usage grows.
If a benchmarking exercise only captures what appears on the vendor invoice, those costs disappear from the analysis. That can make one tool look cheaper than it really is, or make two options look comparable when their true cost profiles are very different.
A reliable benchmark needs a total cost of ownership view from day one. That means factoring in the work required to prepare data, connect the tool to existing systems, and support higher usage over time. Teams using structured estimating systems such as Nomitech often apply this same discipline in capital project cost planning. The principle is no different here. If the inputs are incomplete, the comparison will be too.
It also means budgeting for security compliance, compliance audits, and integration maintenance that are required to make AI systems production-ready. Those secondary expenses are easy to miss in early estimates, especially when vendors focus the discussion on software access rather than the systems, controls, and support needed after deployment.
Using Stale Benchmarks in a Fast-Moving Cost Environment
AI infrastructure pricing is changing quickly. Fast enough that even a benchmark from six months ago can already be outdated.
Stanford HAI's 2025 AI Index Report makes that pretty clear. The inference cost for a system performing at GPT-3.5 level fell by more than 280 times between November 2022 and October 2024. On the hardware side, costs dropped by about 30% per year, while energy efficiency improved by roughly 40% annually over the same period.
That is not normal market drift. It is a major shift. If your benchmark relies on pricing assumptions from last year, there is a good chance it overstates what some AI capabilities cost today. It may also miss the financial upside of moving to a newer solution.
At the same time, total AI spending is still climbing even though unit costs are coming down. Prodia projects average monthly AI spending per organization will rise from $62,964 in 2024 to about $85,521 in 2025, a 36% increase. That does not mean AI is getting more expensive per task. It means organizations are using more of it, in more places, across more workflows.
That distinction matters. If your benchmark does not reflect current pricing and expected usage growth, your forecast can go stale almost immediately.
The practical fix is simple: build refresh cycles into the benchmarking process. Treat pricing data older than three to six months as suspect, and validate assumptions against current market rates before making a decision.
Comparing Tools or Vendors Without Normalizing Outcomes
Even when total costs are captured properly and pricing data is current, benchmarks can still lead you in the wrong direction if the tools being compared are not delivering the same result.
This happens all the time when teams compare AI models or vendors using cost per token or cost per query alone. Those figures can be useful, but only if you also account for output quality, response speed, latency, and the size of the context window. Artificial Analysis reflects this in the way it compares models, looking at quality, price, output speed, latency, and context window together instead of treating price as the only metric that matters.
A model priced at $0.02 per million tokens might look like the obvious low-cost option. But if it needs more tokens to complete the same task, delivers lower-quality output that has to be checked by a human, or responds too slowly for a time-sensitive workflow, then the cheaper option may not be cheaper at all.
The same issue applies at the platform or vendor level. PwC's AI benchmarking framework addresses this by measuring AI investment impact across five dimensions: Financial, Operating, Functional, Trust, and Workforce. It uses more than 30 primary metrics and over 100 secondary metrics to show how AI investment translates into actual outcomes. That kind of structure matters. Comparing vendors on cost alone can push teams to optimize for the wrong thing.
Normalizing comparisons starts with a clear definition of success. What does a good result actually look like for your team? Faster cycle times, better output quality, lower review effort, fewer errors, more predictable operating cost? Once that is defined, every tool or vendor should be measured against the same standard. Teams should also compare inference speed and latency against sector benchmarks because bottlenecks in production often show up there before they show up in headline spending.
Without that baseline, it is not really benchmarking. It is just lining up price tags on different products and calling it analysis.
How to Build an AI Cost Benchmarking Process
A solid AI cost benchmarking process gives leaders a clear view of where money is going, what value it is creating, and where costs are starting to drift. Done well, it supports better investment decisions, fewer budget surprises, and more disciplined improvement over time. In practical terms, the process comes down to three things: know what you are running, measure what actually matters, and compare your position to the market often enough to act on it.
Step 1: Inventory All AI Use Cases, Vendors, and Spend Categories
You cannot benchmark what you have not mapped. Before you compare costs or performance, you need a reliable view of every AI initiative in the business, what it costs, who owns it, and what outcome it is supposed to deliver.
Start with the use cases themselves. That might include customer service chatbots, document processing workflows, fine-tuned language models, or full AI-native applications. These are not small cost variations. They sit in very different ranges. According to AIStackHub, a customer service chatbot typically costs between $15,000 and $80,000 to implement, while a retrieval-augmented generation system for document Q&A can run from $25,000 to $150,000. Fine-tuning a custom large language model ranges from $50,000 to more than $500,000. Building an AI-native product from the ground up can easily reach $2 million or more.
Once the use cases are listed, break spend into full cost categories. This is where teams often miss the real number. Many organizations track subscription or licensing fees and assume they have the picture. They do not. USM Systems highlights several cost buckets that are often overlooked outside those base fees:
- Infrastructure scaling: Usually 15 to 25% of total project cost, often appearing in months three through six and ranging from $15,000 to $75,000
- Data preparation: Roughly 15 to 20% of total cost, concentrated early in the project and ranging from $10,000 to $90,000
- Integration work: Often 20 to 30% of total cost, typically spread across months two through five and reaching $20,000 to $100,000
You also need to capture recurring costs, not just build costs. AIStackHub notes that ongoing API and compute expenses can add 20 to 40% to total costs each year. If those charges are missing from your inventory, your benchmark will look cleaner than reality.
The result of this step should be a living register of AI use cases, vendors, cost categories, and spend levels that leadership can review at any time. In practice, this often works best when managed in a shared cost system. Tools like Nomitech can help structure that view if teams need a more consistent way to track evolving cost data.
Step 2: Set Baseline Metrics for Cost, Performance, and Business Outcomes
Once the inventory is in place, the next job is deciding how success will be measured. A useful benchmarking framework does more than track cost per unit. It connects AI spend to technical performance and real business impact.
PwC organizes AI benchmarking across five pillars: Financial, Operating, Functional, Trust, and Workforce. That framework includes more than 30 primary metrics and over 100 secondary ones. On the financial side, one example is AI investment as a percentage of revenue. On the operating side, it might be the share of customer interactions handled by AI.
That broader view matters. A model or tool that looks cheaper on paper may create problems elsewhere. Lower quality, weaker reliability, or slower output can erase any savings once the workflow reaches production.
When setting baselines, it helps to group metrics into three levels:
- Cost metrics: Total spend by use case, cost per task or transaction, model pricing per million tokens
- Performance metrics: Output speed, latency, response quality, and context size
- Business outcome metrics: Process efficiency gains, customer satisfaction, headcount impact, and revenue influence
If you are comparing models directly, Artificial Analysis is a useful reference point. It benchmarks quality, price, output speed, latency, and context window, which makes tradeoffs easier to evaluate before you lock into a vendor or model choice.
Set these baselines early and document them clearly. That gives you a stable reference for every future comparison, whether you are reviewing one use case, one vendor, or an entire AI portfolio. The important part is consistency. If the measurement logic changes every quarter, the benchmark loses value. In more mature environments, automated pipelines can track model versions, benchmark results, and audit trails over time, which is especially helpful for governance and regulatory compliance reviews.
Step 3: Compare Against Market Benchmarks and Optimize Continuously
With baselines established, benchmarking becomes a regular operating practice, not a one-off exercise. This is where the process starts to pay off.
Model costs alone can vary so widely that routing decisions can make a major difference. Maxim AI reports that cost-aware model routing in enterprise AI gateways can cut overall spend by 30 to 50%. The logic is straightforward. Send simpler tasks to lower-cost models priced around $0.10 per million tokens, and reserve frontier models priced at $15 or more per million tokens for work that actually needs deeper reasoning. That kind of routing only works if you have already benchmarked task types against model capability and cost.
Benchmarking external service rates can uncover savings too. InformationWeek reports that AI benchmarking in IT services contracts can unlock savings of 15 to 30%, driven largely by AIOps efficiencies that providers can pass through to customers. Some categories show especially sharp reductions:
- Service desk pricing has dropped by as much as 50%
- Network, workplace, application management, and security services have seen reductions of around 25 to 30%
- Data center pricing has declined approximately 15%
- BPO contracts have achieved savings closer to 40%
This is why benchmarking should not sit with procurement alone or happen once a year and disappear. Market pricing for AI services is moving fast. Teams that benchmark regularly are in a much better position to renegotiate contracts, shift workloads, and move budget toward use cases that are producing better returns.
To keep the process repeatable, set a review cadence. Quarterly is a sensible minimum. Use that review to refresh the inventory, update baseline metrics, and compare current spend against both internal targets and external benchmarks. Over time, that routine turns cost benchmarking into a real management capability instead of a reactive cleanup exercise.
What Decision-Makers Should Do Next
AI spending is rising quickly. According to Prodia, average monthly AI spend per organization is set to increase from $62,964 in 2024 to about $85,521 in 2025, a 36% jump. For CIOs, CTOs, CFOs, and operations leaders, that changes the conversation. Informal tracking and rough estimates are no longer enough. Cost benchmarking needs to become a structured, repeatable part of how the business plans, reports, and governs AI investments.
Here is how to make that practical.
When to Benchmark AI Costs Across the Lifecycle
Benchmarking is not something you do once and file away. AI costs shift at each stage of deployment, and the metrics that matter early on are not always the ones that matter later.
There are three points in the AI lifecycle where benchmarking tends to deliver the most value:
- Before procurement or model selection. Cost per token can vary dramatically by provider. As Maxim AI notes, budget models may cost as little as $0.10 per million tokens, while frontier models can exceed $15 per million. Benchmarking before you commit helps you line up model capability with the actual job to be done, instead of defaulting to the most expensive option.
- During contract renewals and vendor reviews. AI service pricing is moving fast, and generally downward. InformationWeek reports that service desk pricing has dropped by as much as 50%, while network, workplace, and security services are down around 25 to 30%. If your contracts were signed before those shifts, a benchmark review ahead of renewal may show you are paying well above current market rates.
- When scaling workloads or expanding use cases. What looks affordable in a pilot can become expensive very quickly in production. Benchmarking at this stage helps you see whether your cost structure is improving in step with the market or drifting in the wrong direction. The Stanford HAI 2025 AI Index Report found that hardware-level AI costs have been falling by roughly 30% per year, which means a baseline from 18 months ago may already be stale.
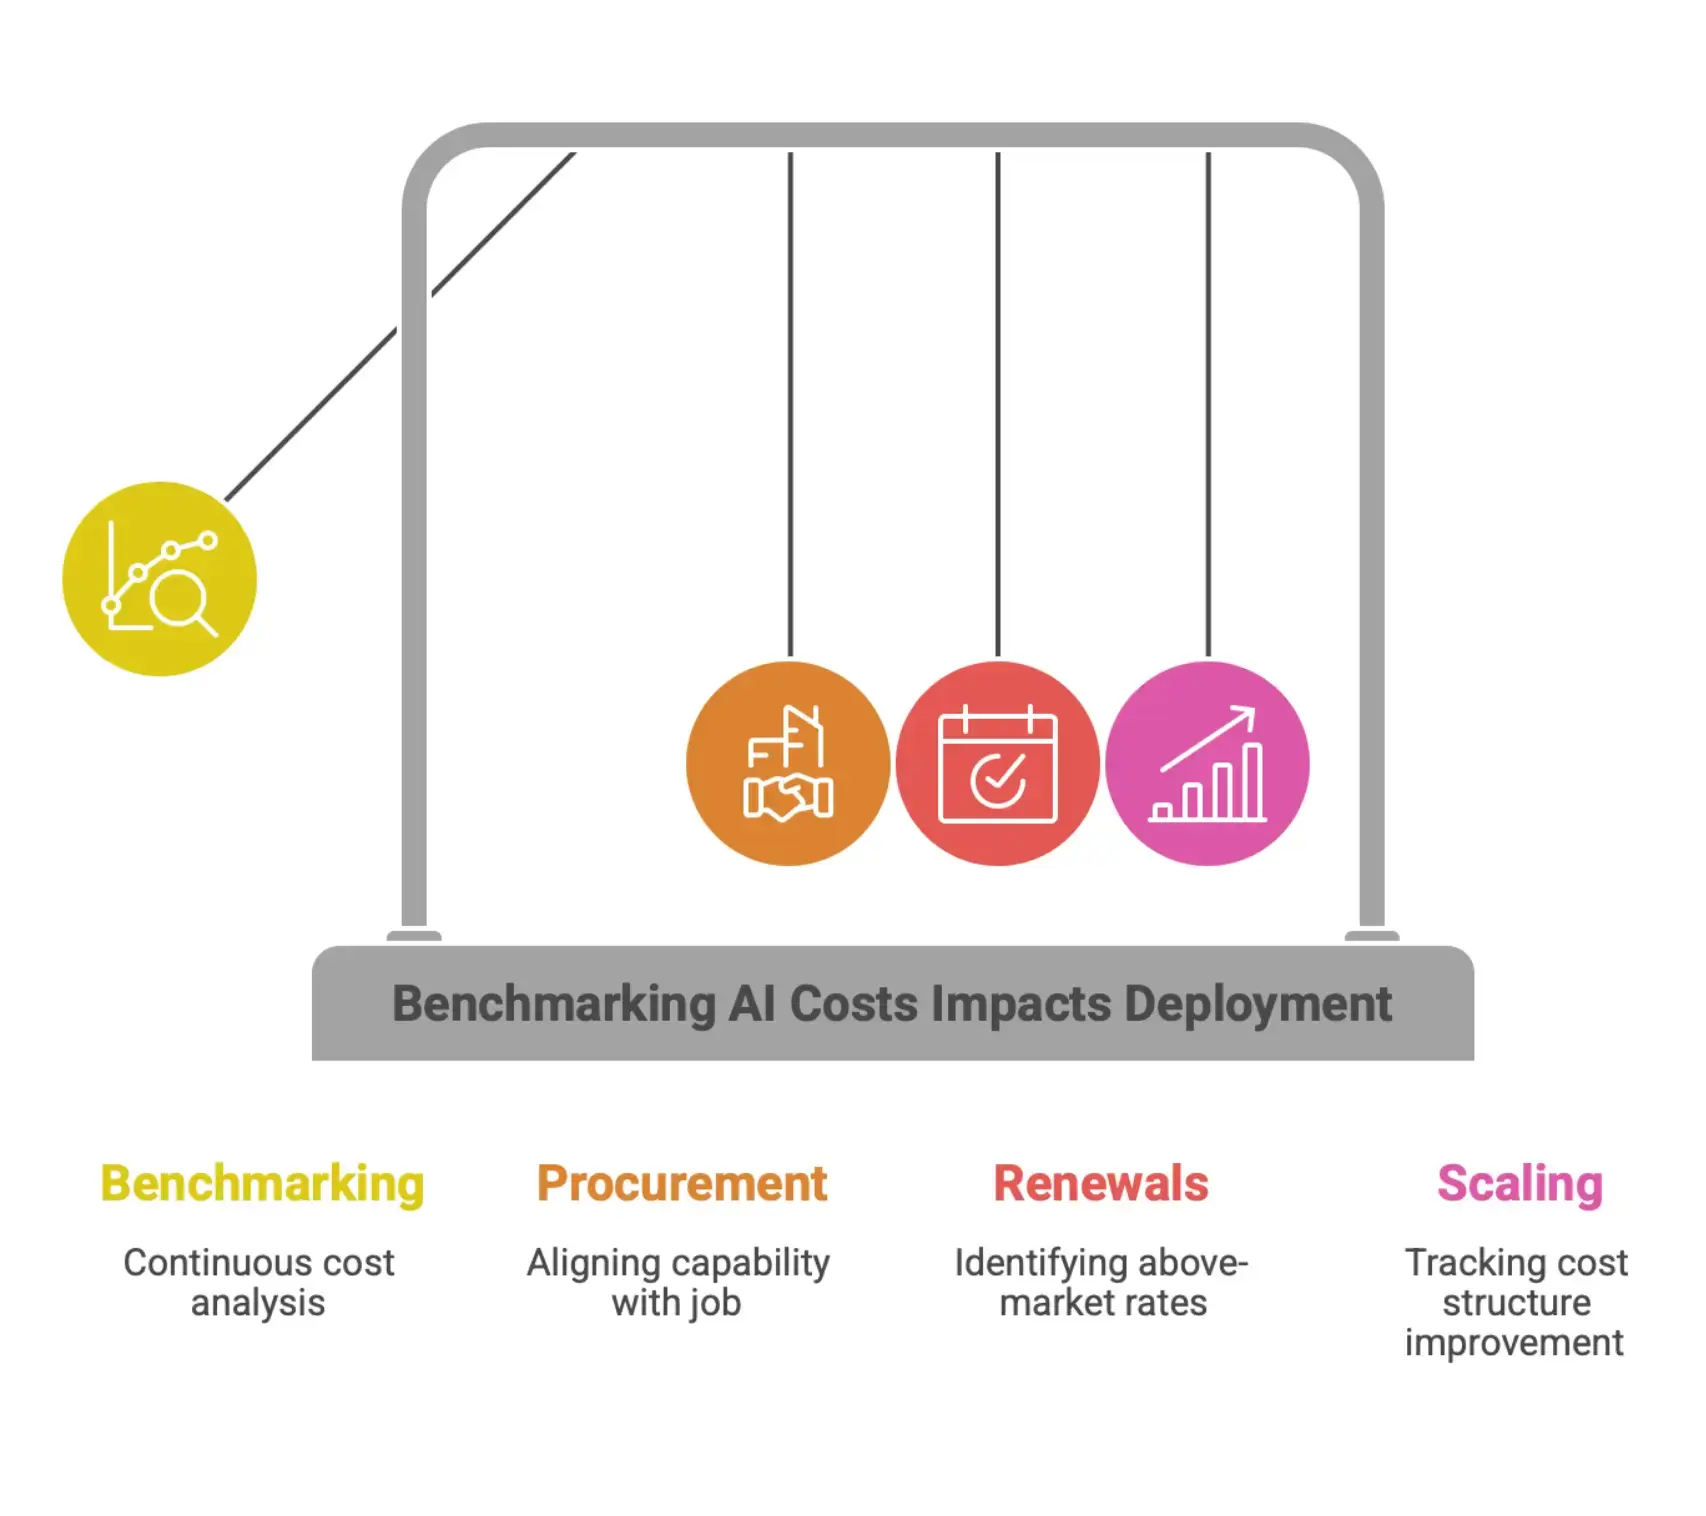
Across all three phases, the main question is simple: is your internal cost curve moving with the market, or against it? If your spend keeps climbing while market rates are falling, it usually points to an issue in architecture, procurement, vendor management, or all three.
How to Use Benchmarks in Budgeting, Board Reporting, and Vendor Negotiations
Benchmarks matter when they shape decisions. Used well, they give finance, operations, and technology leaders a clearer basis for action in three areas that carry real weight.
Budgeting
Use benchmarks to test AI budget requests before they get approved. If a team is asking for a major increase in spend, benchmarking helps you separate real workload growth from avoidable inefficiency. Structured models like the one developed by PwC, which evaluates AI investment across financial, operating, functional, trust, and workforce dimensions using more than 30 primary metrics, give finance teams a consistent way to judge whether the spend is producing measurable value.
Board Reporting
Boards are asking tougher questions about AI now. Not just how much the company is spending, but what it is getting back. Benchmarking gives you a stronger answer. Measures such as AI investment as a share of revenue or the percentage of customer interactions handled by AI, both included in the PwC framework, help put internal results in context. That is far more useful than reporting raw numbers on their own.
Vendor Negotiations
Benchmarking is one of the most effective tools you can bring into AI and IT contract negotiations. When you have current market data in hand, you are negotiating from evidence, not instinct. InformationWeek notes that AI benchmarking can uncover savings of 15 to 30% across IT services contracts, with BPO agreements reaching closer to 40% in some cases. That is hard to ignore at renewal time.
This is also becoming more important inside finance transformation. Research shows that many CFOs now see artificial intelligence as central to finance modernization, yet far fewer are optimizing it in core processes. That gap is exactly where benchmarking can help by tying AI investments back to clear business value, cost control, and strategic objectives.
Turning Benchmarking into an Ongoing AI Governance Discipline
A common mistake is treating benchmarking like a one-off project. That approach gives you a snapshot, but in AI, snapshots age quickly. Costs, service pricing, hardware efficiency, and model economics can all shift within a few months.
To make benchmarking part of AI governance, organizations should focus on a few fundamentals:
- Establishing a regular review cadence. Quarterly reviews tied to budget and planning cycles keep benchmarks current and useful. They also make it more likely that cost data will influence decisions instead of disappearing into a slide deck.
- Assigning ownership. Benchmarking works best when finance, technology, and operations share the process. Someone still needs clear accountability for maintaining baselines, tracking key metrics, and flagging anomalies when they show up.
- Connecting benchmarks to architecture decisions. Cost data should directly influence workload routing and model selection. Maxim AI highlights that cost-aware model routing, where simpler tasks go to lower-cost models and frontier models are reserved for harder reasoning, can cut total AI spend by 30 to 50%. That only works if you are benchmarking continuously enough to know which tasks truly justify premium model costs. In practice, teams often operationalize this through estimating and cost control workflows in tools like Nomitech, where benchmark inputs can be tied back to planning assumptions and forecast updates.
- Tracking efficiency gains alongside cost trends. As Stanford HAI reports, energy efficiency in AI hardware has improved by 40% annually. Teams that follow trends like this can make smarter infrastructure decisions earlier, instead of reacting after costs have already crept up.
- Preparing for more autonomous systems. As agentic ai expands, each business process may involve chains of prompts, tools, and validations rather than a single request. That increases both opportunity and exposure. Agentic ai can deliver stronger automation and faster decision making, but it can also multiply token use, latency, and monitoring needs if left unmanaged.
With global AI infrastructure investment projected to reach $375 billion in 2025, according to Prodia, organizations that build benchmarking into their governance model will be in a much stronger position to manage that spend intelligently. The point is not to benchmark for the sake of benchmarking. It is to make better decisions, faster, with a clearer view of cost, value, and tradeoffs.
Frequently Asked Questions
What is AI cost benchmarking in simple terms?
AI cost benchmarking is the process of comparing AI spend and performance against internal baselines, market references, or business targets. The goal is to understand whether AI investments are delivering value for the money being spent.
What costs should be included in AI cost benchmarking?
A useful benchmark should include more than software or model pricing. It should also account for implementation costs, data preparation, integration work, infrastructure scaling, and recurring run costs such as API usage, compute, storage, monitoring, and support.
Why is AI cost benchmarking important for enterprise teams?
It helps finance, procurement, and technology leaders manage rising AI spend with more control. Benchmarking supports better budget planning, stronger vendor negotiations, clearer board reporting, and earlier detection of overspend or underperforming investments.
How often should organizations benchmark AI costs?
Quarterly reviews are a sensible baseline. AI pricing, infrastructure economics, and usage patterns move quickly, so benchmarks that are several months old may already be outdated for planning or procurement decisions.
How do teams compare AI models fairly on cost?
They need to normalize for outcomes, not just compare price per token. Useful comparisons should include quality, latency, speed, context window, and the business requirements of the actual use case.
Ready to Take the Next Step?
If you’re exploring modern cost estimation platforms, check out Nomitech’s full suite or get in touch with our team to find the right fit for your workflows.





Stay Up to Date
Subscribe to our Newsletter today and receive the latest updates, trends, expert insights, and exclusive offers tailored to your specific industry.